Our suspicion about a potential deep retrace proved to be helpful (Technical Damage (10/17/14)). SP500 has retraced 72.8% of the entire 18-day selloff in 1/3 of the time, regained its 200-day moving average and is within 2 index points of regaining its 50-day moving average.
Here are the key questions at the moment.
[1] What is the upside potential of this upswing before (at least) a meaningful pullback?
[2] Is a new record high in sight before the October low is at risk?
[3] How does it fit into the longer term tracking counts?
*** near term tracking ***
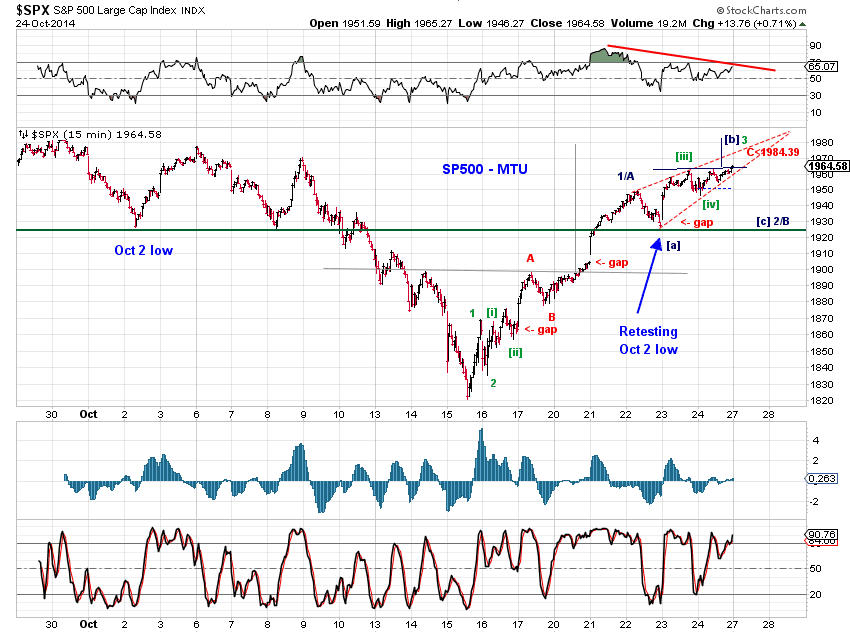
[the blue wave [b]-up of a small-degree expanded flat or a triangle] where the first up leg of the rebound completed on October 22nd and a sideways pullback is now in progress. This scenario offers the potential of a new record high or a triple top.
[the green wave 3] where the rebound is a regular five-wave impulse attempting new record highs. It's also prudent to allow for a failed impulse in this case.
[the red wave C] where the rebound is a corrective ABC structure with wave C being an ending diagonal triangle. In this case, wave C should be capped by 1984. A retest of the October low is next.
*** new record high ***

A new record high on this run is possible if the blue and the green counts in Chart 1 play out. Note also that while SP500 is 2.75% away from a new hgh at Friday's high, the Transports are only 1.69% below a fresh record high.
Chart 3 (MMM) and Chart 4 (GD) shows two individul stocks with (very) similar recent price structures as that of SP500 are now making new highs. Readers can check similar actions in other SP500 components such as ABBV, FISV, GILD, LEG, LOW, UNH, and UNP.


*** long term tracking ***
