Stocks

At Friday's high in SP500, the proposed wave [e]-up is now slightly longer than the proposed wave [c]-up. Wave [e]-up has now satisfied the minimum requirement of an expanding EDT and has also delivered a typical overthrow.
Chart S2 presents our primary tracking counts on SP500 since the October low.
The blue count tracks a regular impulse wave and the green count tracks a zigzag, accommodating wave (a) of [e]-up and the entire wave [e]-up respectively.
The black count tracks a much extended wave (5) of [3]/C or wave [5] highlighted in Chart S5 below.
Chart S3 presents the corresponding squiggle counts since November.


It's unclear whether the pending high is the entire wave [e]-up OR wave (a)-up of [e]-up which implies a wave (b)-down pullback and another wave (c)-up thrust to new highs. However, we can make the following observations.
[1] At least a pullback is expected under either scenario. The primary support is around 1995.
[2] While price has already entered the topping zone, time has not. Under normal circumstances, it is likely to take wave [e] longer than wave [c] to finish its run. If this is the case, odds appear to favor the pending high being wave (a) of [e]. Wave [e] could take its time, running longer than 5.5 or 7.5 months.
[3] If the market subdivides much above the upper green trend line in Chart S2, consolidates sideways and increasingly agrees with the black tracking count in Chart S2, odds then favor the subsequent pullback to breach the October low, based on the larger counts in Chart S5.
[4] For the very near term, squiggle counts (Chart S3 -green, blue) suggest another brief upswing is likely, although Friday's high could be "it" (Chart S3 - red). Monitor for a breach of 2046.8 and 2041.28 as logical decision points. Also see our analysis of the USD squiggles below.
Chart S4 illustrates how this lengthy expanded ending diagonal triangle fits into the big picture since the 2009 stock market bottom. Chart S5 offers our other long term tracking counts.


Bonds
The 20+ bp rally in 10-year Treasuries in November has not changed the big picture in long term benchmark rates (Chart B1).
After rebounding from the green prior breakout trendline in Chart B1, rates took their time to retest potential multiple support levels in November (Chart B2). The retest is likely to be successful. Expect a multi-month sell-off if that is the case.


USD
The sideways consolidation in the USD index has left our long term tracking scenarios intact (Chart $1). As discussed before, the USD index is likely wrapping up a five-wave advance since its May low (Chart $2).


Gold
After a brief false downward break out of its 2-year range, gold (priced in USD) has regained that range and was retesting the range's lower trendline this past week (Chart G1). With positive technical divergence noted on the chart and USD dynamics, this 2-year range is likely to hold for the intermediate term.
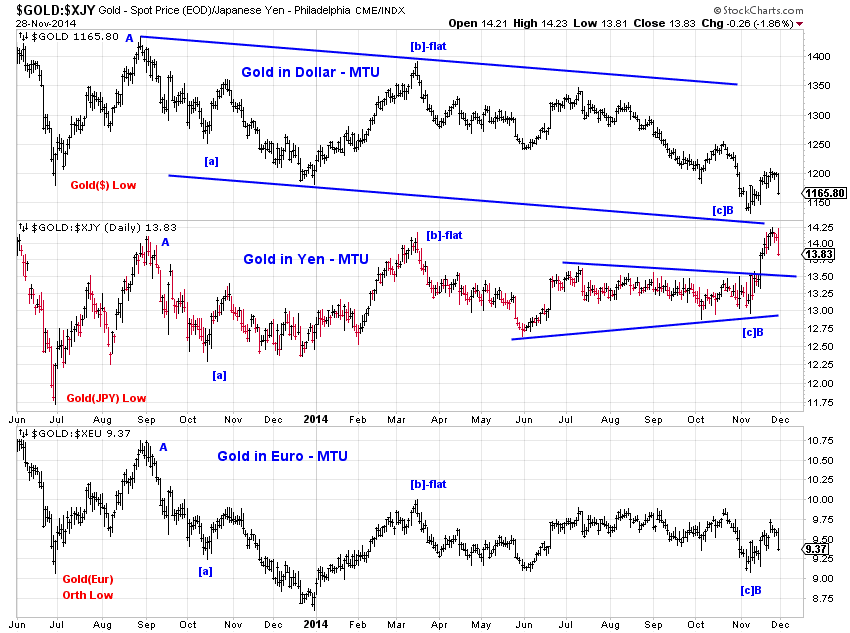
Our intermediate term bullish outlook on Gold also reflects the potential implications by price actions of gold priced in Yen and Euro. See Chart G2.
However, as the tracking scenario in Chart G2 suggests, the proposed upswing in Gold is likely wave C of a bearish upward flat and thus unlikely to push gold to new highs.