At this week's low, SPX is down 8.21% from its nominal high in May. However, the larger sell-off and the decline earlier this week have not materially resolved the two dramatically opposite intermediate term scenarios (Chart 1 and Chart 2).


On the bullish side, the market has completed or is approaching the end of an (expanded/running) flat since the Feb high (Chart 1, red).
On the bearish side, the sell-off since May is the initial decline of a trend change to the downside (Chart 1, blue).
At the moment, SPX has tested its 200-day moving average, which is being mildly defended (Chart 1, green line).
Chart 2 above illustrates these scenarios based on a potential small zigzag structure for the hope rally - one of the four long term scenarios discussed in Tracking Scenarios (6/10/11).
Near term outlook
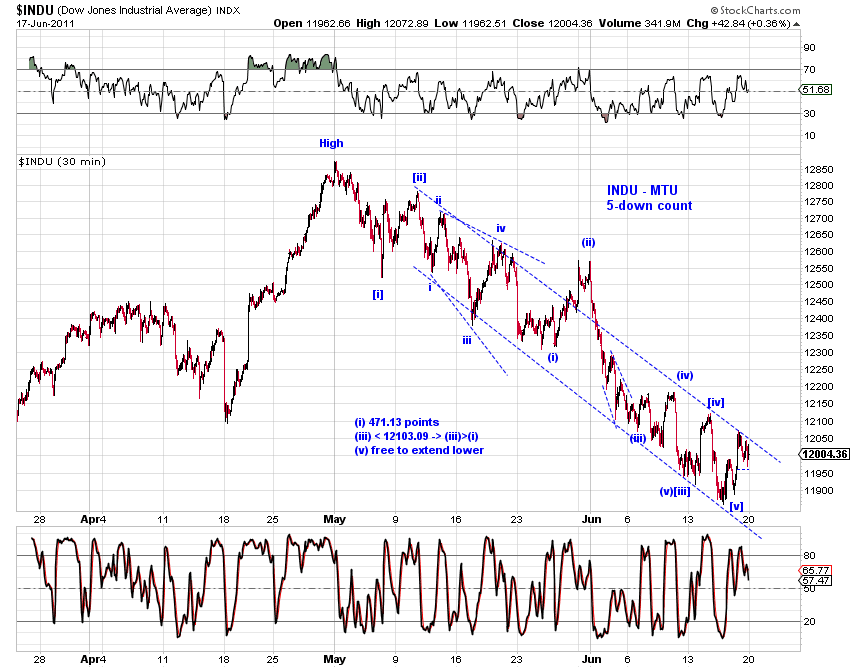
 Barring a "crash", there appear to be three reasonable ways to count the decline since the May high. Chart 3 (SPX), Chart 4 (INDU) and Chart 5 (WLSH) illustrate, all suggest that a near term bottom is approaching.
The proposed bottom would be the end of wave C of a multi-month flat based on the bullish count OR the end of wave [i]-down based on the bearish count.

Squiggles
The rebound from Thursday's low is reasonably weak. Moreover, bulls are yet to produce an impulse-wave advance, especially in futures. Chart 5 (SPX) and Chart 6 (ES) offer squiggle counts.

