Tuesday, November 30, 2010

Market Timing Update (11/30/10)

[625pm] Here's another bearish count discussed yesterday that has essentially the same implications as that of the primary bearish count in YM (4pm entry).

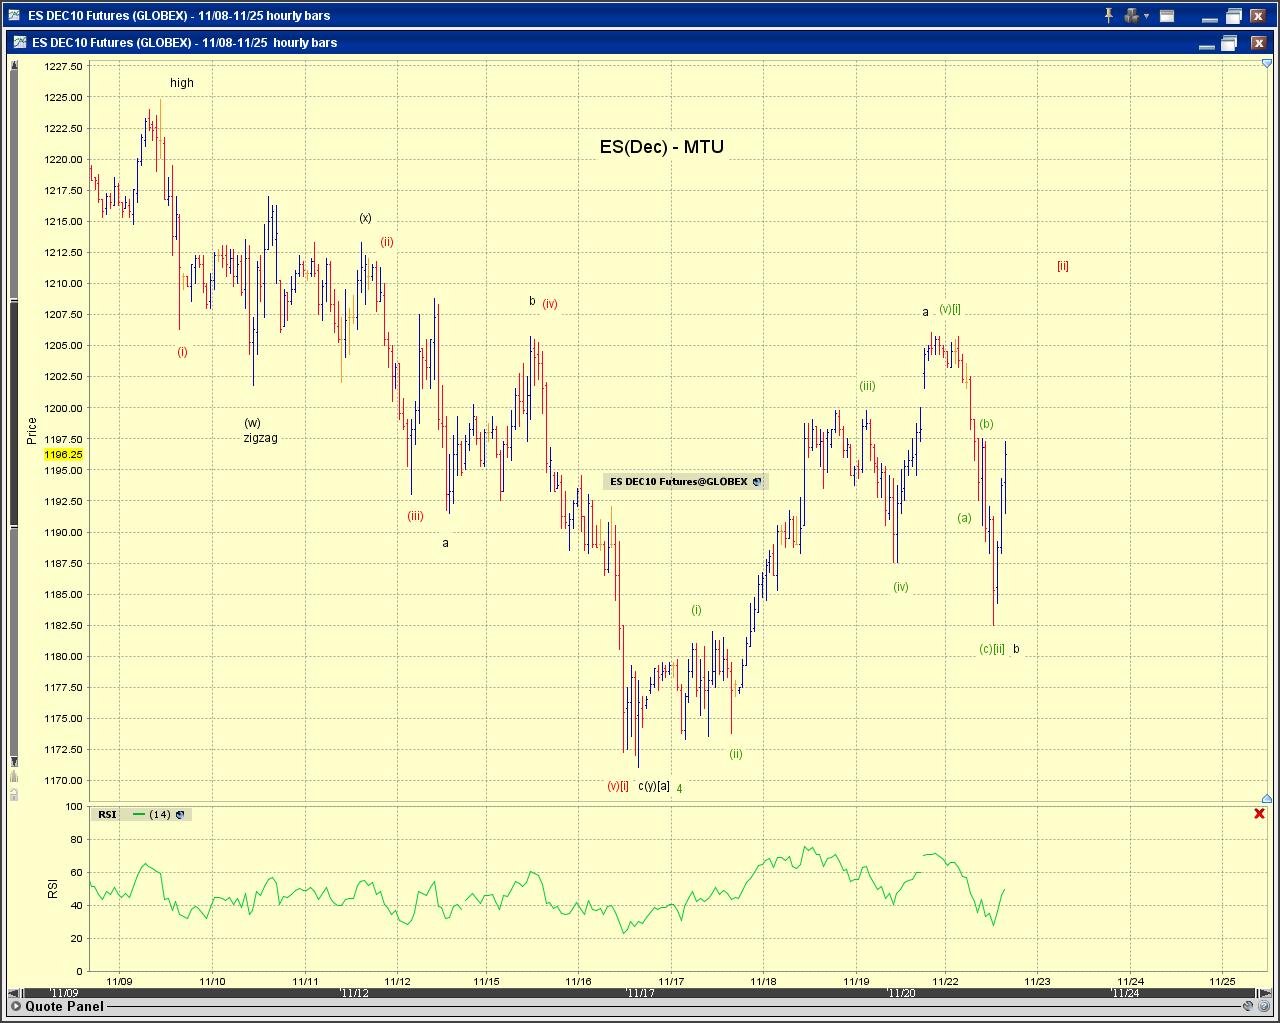
The entire decline is five(or three)-zigzag-ED. One more thrust lower completes a larger three pullback.


[4pm] Stocks -
There's not much to add to the [2pm] and [1250pm] updates. The following charts update the tracking counts.

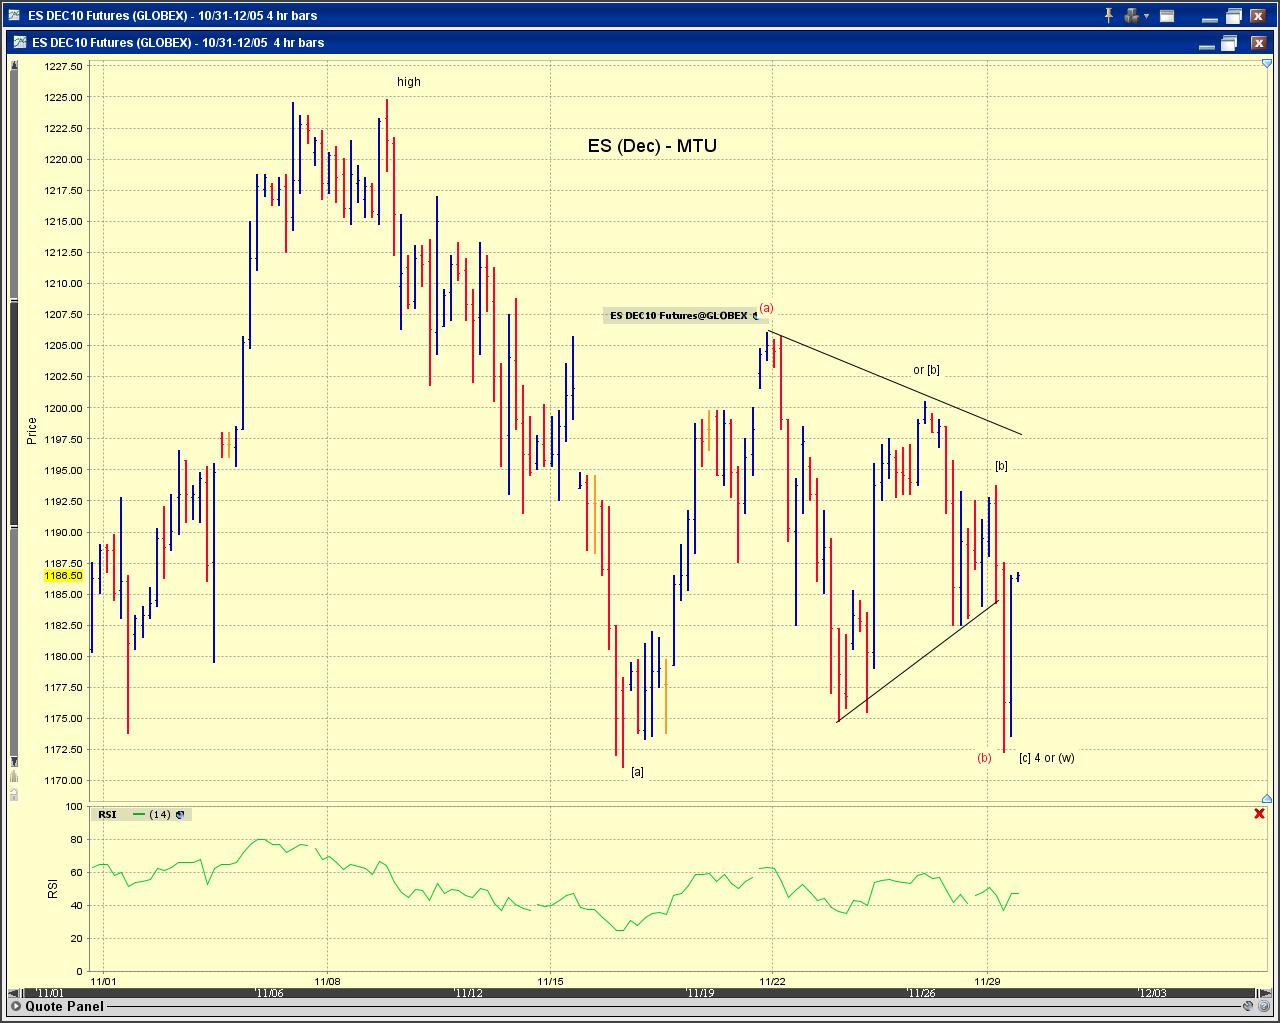
The chart to the right outline the primary bearish (blue) and primary bullish (green) counts. The charts at the bottom update the squiggles.

The primary bearish count (red trend lines) is that a small degree fourth wave is developing. The final thrust down out of this triangle is (v) of [c] of (say minor wave 4). The more bearish interpretation is that it could be [i]-down of 3-down (red labels), but it is too early to tell.

The primary bullish count (black trend lines) is that an initial [1][2] or a/b is developing from yesterday's low (out of a downward thrust from a larger triangle). See the green and black counts.

The coming MTU weekend edition will take another look at the wave structure of the hope rally.


[2pm] Count update -
The upper red trend line for a potential fourth wave triangle needs to be broken (point a to be exceeded) for additional near term upside potential.
[1250pm] Squiggles -


Additional real time update entries are archived at MTU Real Time.

Sunday, November 28, 2010

Market Timing Update (11/29/10)

[3pm] EOD update
The overlap resulting from the afternoon rebound suggests that the near term decline is likely over. See ES and YM charts at the end.

On the bullish side, today's low (lower low in INDU but not in other indexes) could be the end of minor wave 4 correction. The more bullish profile in the Nasdaq indexes goes well with this interpretation, so far (Chart 1).

Should [c] of 4 be a double zigzag, today's low is (w) of [c] of 4, with the rebound being (x) of [c] of 4.

Also open to the possibility of an ED [c] of 4, but it is too early to call.

For those who are looking for an endless sideways minor wave 4, today's low is likely (b) of [b] (flat or itself a triangle). Once [b] concludes, minor wave 4 can decide on its form, again (flat? triangle?).

Why should one be reluctant to anticipate further sideways movement? If the larger count is correct, minor wave 2 had lasted 3 weeks and the current minor wave 4 has lasted 3 weeks with this week being the fourth week (Chart 2).


Previous real time entries for the day are archived at MTU Real Time.

***

Friday, November 26, 2010

MTU Weekend Ed. - Coiled Spring (11/26/10 Close)

Stocks -- The whipsaw action over the holiday week has shaped the stock market into a coiled spring. The pending breakout is likely to be swift and potentially strong.

The primary scenarios are a swift follow-through sell-off to complete the second part of the decline since the November high (i.e./e.g. minor wave 4) , a forceful rally to start the main upward thrust of minor wave 5 (e.g. wave (iii) of [iii]), and a moderate rebound to continue the sideways wave 4 consolidation in the form of a triangle.

The direction of the breakout, however, is not as clear-cut as one might think.

On one hand, sovereign debt concerns, rising risk premia, a flight to the USD and the appearance of a bear flag argue for at least a swift follow-through sell-off next week.

On the other hand, support from the 50-day moving average on multiple occasions over the past two weeks and the relative strength in the Nasdaq indices, the Russell 2000 index and the DJ Transportation Average have preserved the potential for a nested [i][ii](i)(ii) count (immediately very bullish) and a larger triangle (sideways).

These observations are well reflected by Char 1 to Chart 5.

Thus, Tuesday’s low of 1176.91 and Thursday’s high of 1198.62 in the SP500 index are important support and resistance levels. Note that the SP500 closed at 1189.40, around the 60% division of the 1176.91-1198.62 range.

SP500

YM - Dec INDU mini

NQ - Dec NDX mini


USD -- The USD index has now recovered above its July low on recent strength (Chart 6). This development is important from an EWP perspective as it eliminates the immediately bearish possibility that the recent rebound is a small degree fourth wave. It also lends support to the immediately bullish green count that a small degree third wave is already in progress.

However, the USD index is not totally out of the woods yet per the blue count and to a lesser extent the red count. Note that the rebound so far has retraced 37.4% for the April-November decline in the form of a potential zigzag (Chart 7). Based on the blue count, the current rebound would be B of (Y) in a complex three.

Thursday, November 25, 2010

Market Timing Update (11/25/10)

[9pm] YM -


* ES high of the morning session was 1200.50

[1115am] ES , YM-
[935am] ES , YM-

Wednesday, November 24, 2010

Market Timing Update (11/24/10)

[4pm] Stocks
Chart 1 updates the larger count. Chart 2 updates the structure since the Nov high. Chart 3 offers a squiggle count of today's advance.

Real Time Update archived at MTU Real Time.

Tuesday, November 23, 2010

Market Timing Update (11/23/10)

[8pm] ES
Overlapping of potential w1 and w4 supports the immediately bullish potential or a terminal ED before a bounce. see the 4pm update.

[4pm] Stocks
There's no resolution yet regarding whether the decline from the Nov. high is the beginning of a larger trend change or a corrective minor wave 4 pullback. But ...

... within the bearish count (red), today's decline is more likely to be (b)-down of [ii]-up rather than (i)-down of [iii]-down.

... within the bearish count (dark), today's decline is either [c]-down of minor wave 4-down or [ii]-down of minor wave 5-up. In other words, minor wave 4-down is zigzag- (or double-three)- like or is already over.

If so, both the bullish and bearish counts suggest a meaningful rebound, after perhaps some additional decline which likely to be swift but moderate (as a potential small degree triangle may be developing).

This additional decline may or may not be required if minor wave 4 is indeed over. Note that outside of SPX and INDU, today's decline in other indexes is not as deep.

While the triangle or flat option for minor wave 4-down are attractive with respect to alternating with minor wave 2-down, it appears to be taking too much time to fully develop.

Chart 1 and Chart 2 offer the large count as well as a squiggle count on the ES.


Real Time Update archived at MTU Real Time.

Monday, November 22, 2010

Market Timing Update (11/22/10)

[4pm]Stocks
Chart 1 updates the three tracking count on ES. Odds appear to favor at least a continuation of the rebound from today's low. See Fourth Wave Consolidations (11/19/10) for additional discussions.

The squiggle count from today's low is somewhat ambiguous. Chart 2 offers three counts. The green count has the best form but its iii of (i) appears a bit forced in SPX, but less so in INDU. Tomorrow's price action will help clarify the squiggles.


[Real Time Update]
Archived at MTU Real Time.

Friday, November 19, 2010

MTU Weekend Ed. - Fourth Wave Consolidations (11/19/10 Close)

Stocks, gold and USD have been more or less in sync recently. This is intuitive as a major driver of late is the initial front-running of QE2 and the subsequent reaction to the actual announcement.

The weekend commentary highlights the potential for a simultaneous fourth wave consolidation in these asset classes, and "fat-tail" risks. The fat-tail risks are (1) that the fourth wave consolidation has already completed, and (2) that the proposed fourth wave is actually the beginning of a trend change (i.e. the top / bottom is already in at the recent price extremes.)

A potential common development across stocks, gold and USD is that they are all experiencing a fourth wave consolidation from their respective recent price extremes. Stocks and gold have been correcting downward and USD is correcting upward. Moreover, the potential fourth waves in gold and USD are flats and are satisfactorily alternating with the second wave zigzags. (Chart 1, 2 and 3).

If these are fourth waves, the fourth wave flats in gold and USD appear complete . Stocks too? In particular, the recent high in USD is bumping against the second wave low (red count in the USD chart). There lies the risk/potential that the pullback for stocks may be over as well. Note that stocks did trace out a small-degree five wave advance from the recent low.

In global markets, Canada's TSX is one of the best candidates to illustrate the risk/potential that the proposed 4th wave correction could already be over (Chart 4 and Chart 5). In addition, Germany's DAX may already be in its 5th wave; India's BSE and UK's FTSE may have completed its 4th wave flat if the current advance has not topped.


At the other end of the spectrum, the risk/potential that the top/bottom may already be in at recent price extremes. The green count in the USD chart updates the bullish nested 1s2s count. The red count in the Gold chart updates the somewhat rushed completion of minor wave 5. If so, the recent trend-bucking "retracement" is actually the beginning of a new trend. There lies the risk/potential that stocks have topped as well (the red count in the SPX chart). In addition, as mentioned before, the recent nominal high in stocks was registered in a fibonacci 89th week since the March 2009 low (Chart 6).

Chart 7 presents a creative yet valid initial impulse wave down from the high in the Dow mini. The same count can be mapped into the SP500 mini as a leading diagonal due to a slight 1-4 overlap. As of Friday's close, the wave [ii]-up rebound has take about 50% of the time and retraced about 50% of the decline. The primary count under this interpretation is for a deeper retrace to finish the zigzag, although wav [ii]-up can end anytime as we may have a flat-x-small zigzag going.

Market Timing Update (11/19/10)

[4pm] Stocks
We have a nearly complete five up from this morning's low, as well as a nearly complete five up from the Nov 16th low. In terms the larger count, this leg of advance would be either a of [b] of minor wave 4-down or [i] of minor wave 5-up. To a lesser degree, it could possibly be (a) of [ii]-up under the bearish count (red), but the sub-divisions of [i]-down is not obvious.

[1020am] -----------------------------[302pm]
[730am] Stocks appear to have completed an upward flat or the first three waves of an impulse from the Nov 16th low. Leave room for that low to be [a] of 4, or 4 itself. A bearish nested 1s2s is not totally out of the picture - see the red count on ES.