

The most likely wave structure since the August low is a zigzag (pink). In hindsight, senior indices such as SPX have been tracing out a string of overlapping threes over the past month that show the signature of an ending diagonal triangle – but an expanding one in this case. On more fresh high should complete the pattern. The red-count has the high already in place this past week. And the blue-count has the market in the early stage of a small-degree fifth wave which in itself could be a contracting EDT. Chart 2 presents the corresponding squiggle counts of the market action over the past week.
 Much ambiguity exists regarding the more relevant question - Is this top minor wave 2 or intermediate wave (B) that leads to a sizable reversal OR minor wave 3 since the July low that only leads to a minor wave correction as discussed in Unfinished Business (update 1-10/15/10) and Unfinished Business (update 2-10/22/10)? The proposed decline in the near future will shed light on the issue. Chart 3 illustrates.
A sizable reversal could be logical given strong bullish sentiment, unusual complacency (Chart 4 and Chart 5, VIX), and the relentless front-running of QE2 that has already pushed many USD-crosses to the limit. A continued rally into the year end after a pause is unlikely to change the big picture, but does alter market timing and the wave structure since the 2009 bottom. The August high is a logical stop for those with a bullish view. The proposed top (once it’s identified) is a logical stop for those with a bearish view.


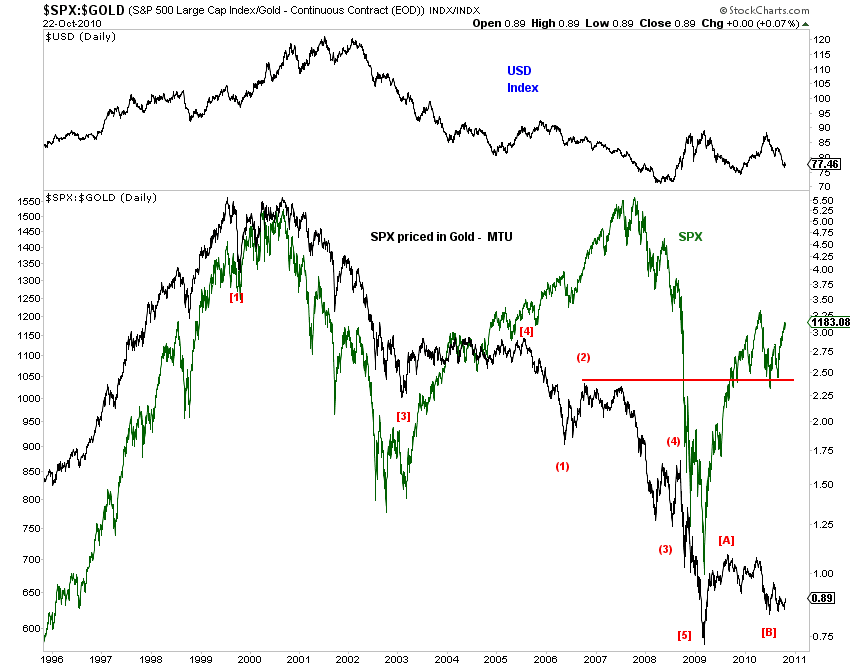 Finally, it’s important to monitor stocks priced in Gold (Chart 6), which looks poised to surge and triple its current level. There are only four ways to support this bullish outcome in the Stocks-Gold ratio (see Dollar Bottoming and Risk Assets Topping (10/8/10)).