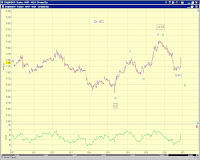
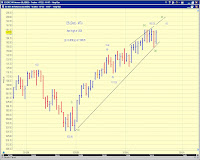
The proposed small degree 4th wave in ES (spx) - iv or [4] in this chart - is larger than ideal. An expanding ED? A series of 1s 2s? A much more bearish development?
The corresponding structure in YM (indu) has a much better form at the moment. Divergence in the making?

 [950pm] USD update and thoughts -
 Odds do not favor a bull run in the USD index if the recent low is violated, IMHO. See the first chart. The bullish scenario almost demands that the USD index is tracing out a series of 1s and 2s OR a leading diagonal. Note that the turn from the late 2009 low in the USD index started with a regular five though.

 [4pm stocks] The [3pm] entry remains applicable. The following charts offer an update.
 Some observation regarding the larger picture.
[1] The April-July decline is most likely a three, unless one molded it into an unconfirmed LD.
[2] The July-present rally is definitely a three so far.
[3] Sentiment of "strategic-bulls" around the July low was most likely very similar to the present sentiment of "strategic-bears".
[4] With a three followed by a three to date since the April high, there's no confirmation regarding either direction, yet.
[5] But ....., you say.
[6] The Chart to the right is for you to decide if it makes sense to bottom fish for the holidays. This chart roughly flips SPX upside-down (i.e. 1 divided by SPX).

 [3pm stocks] The larger picture and short term squiggles. Please also refer to yesterday's EOD update for additional comments.
