 Chart 1 (which updates Chart 1 in yesterday's update) tracks the near term price action well. It highlights the three near term top counts in SPX.
(blue) Triangle [iv], followed by a [v] being still in progress. Today's price action greatly increases the odds that wave [v] is tracing out an contracting ending diagonal (Chart 2). Chart 3 offers a squiggle count of (v)of [v] or (e)of [v].
A much more bullish alt count is that (iii) of [v] is extending, with today's high as [1] of (iii) of [v]. This possibility is also marked in Chart 3. The probability is not high though - we'll see.


 (red) Non-triangle [iv], followed by an expanding ending diagonal.
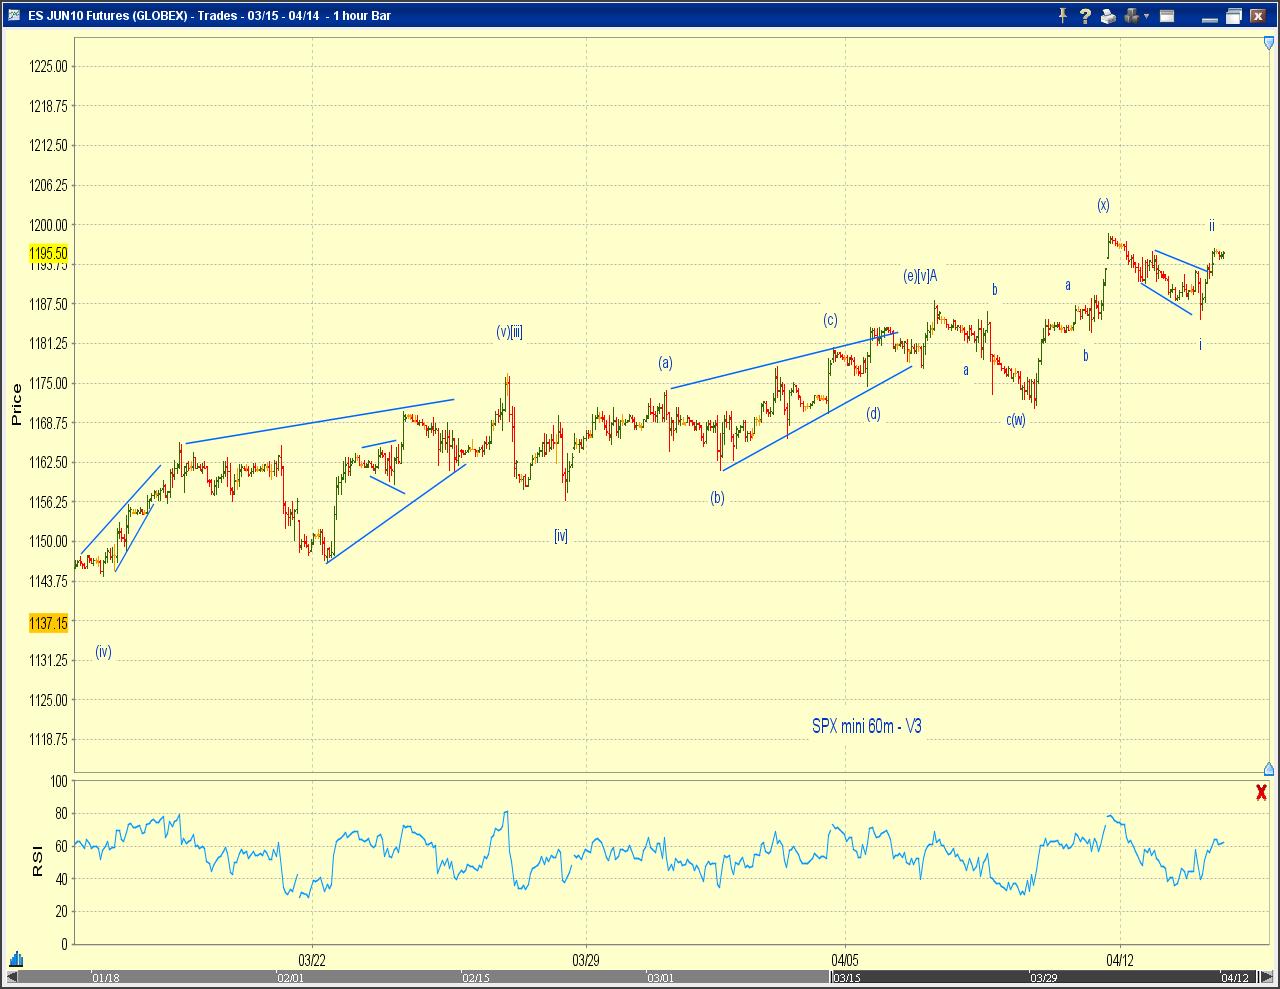
This count suggests that the 4/11/10 after-hours high in the futures is most likely the top. The decline from that top is a leading diagonal wave i-down. And the rebound from today's low is a zigzag wave ii-up - as long as there's no more new recovery highs (Chart 4).
 (green) Wave A of (Z) ended on 4/6/10. Wave B of (Z) is tracing out an expanded triangle. Wave [c]-down of B started at the 4/11/10 after-hours high in the futures (Chart 5). The count of the decline from that top is the same as the one discussed in the red-labeled count above.
No comments:
Post a Comment