SPX is up 7.03% (dividend excluded) for the first quarter and back at the resistance zone (Chart 1).
A plausible bearish triangle since June 2022 is less probable since the Dow has exceeded its August high in December.
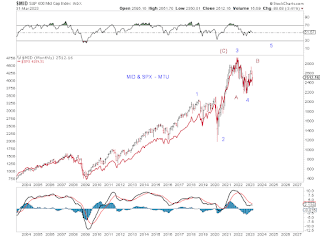
Chart 2 updates the tracking scenarios ( blue 5 and red Bs ).
Chart 3 presents squiggle counts.
Mid vs SPX, long term
MID vs INDU, since 2022


SMAC Update 31 March Week & Mth End Mkt Close -
ReplyDeleteMy SPX & DJIA SMAC trend indicators are both turned UP as of Fridays close.
But note: past obv show any turn in direction is not properly confirmed unless the move up follows for 4 trading days, and in the current data-stream a fall of size Monday Tuesday will turn them down again.
Given the EW counts and MTU's Chart 3 above one would have to be cautious at this point in sole reliance on them. And in terms of other indexes tech positions.
New SMAC - for WILSHIRE 5000 Price Index
ReplyDeleteI have done a Special Moving Average Calc for the Wilshire 5000 Price Index as a control comparison. Its results for turn signals are -
Turned Down on 30 August 2022
Turned Up on 20 October 2022
Turned Down on 13 December 2022
Turned Up 25 January 2023
Turned Down on 1 March 2023.
And it has not turned up yet - continues to move down unlike DJIA SPX SMAC.
My SPX & DJIA SMAC trend indicators are both turned UP as of Fridays close.
SMAC Update 3 April 2023 Mkt Close -
DeleteW5000 SMAC continues to move down.
DJIA & SPX SMAC moved up modestly.
Note a visual review of the DJIA SMAC curve for for the past 12 mths compared to previous curves in past years its pattern shows a picture seen before mid cycle where it has temp rise (like in Feb) then continues down but in the second down leg it has a pause in it (at a point like now). Because this type of thing has been seen before I am cautious about relying on the SMAC calling a low on Friday.
I am unable to find a online excel file data download for MID (for the past 5yrs at least) as I think its SMAC curve would be better to use. This is why I chose W5000. If you can point me at a link for that MTU I will do one.
Review of US INDEXES - End of March
ReplyDeleteInteresting to note MID has formed almost a symmetric triangle.
DJIA NYA have similar patterns, but NYA has 5 minor waves down from the Feb High to the March low and so far 3 up. There may also be same on DJIA from Feb is the upper wave is hidden in the topping area.
SPX & NASDAQ show also 5 minor waves down to March low but a strong 3 waves to almost the Feb high.
NASDAQ has had a history the past decade of its wave patterns being distorted and we see this still when reviewing the past 6 mths of waves which may have bearing on the current picture.
If the main trend was about to turn up you would usually see 2 years of declines (aka 1981-82 and 2000-2003) or weak / restrained sideways trading (aka 1991-1993) beforehand but this has not happened the past 2-3 years. So we should conclude something else perhaps is going on here on the bigger picture.
Your thts on all this MTU ? Particularly MID.
MID tracks SPX well long term. MID tracks the Dow in recent 2 years. See charts of MID above in the post. Regarding cycles and waves, this time is probably more different (than the past few decades), with volatility stemming from currency wars and resulting capital flows and asset rotations.
DeleteYour Chart 5 MID line doesnt seem to match the one I see online ?
Deletehttps://bigcharts.marketwatch.com/advchart/frames/frames.asp?show=&insttype=Index&symb=MID&x=42&y=17&time=9&startdate=1%2F4%2F1999&enddate=4%2F3%2F2023&freq=1&compidx=aaaaa%3A0&comptemptext=&comp=none&ma=0&maval=9&uf=0&lf=1&lf2=0&lf3=0&type=2&style=320&size=2&timeFrameToggle=false&compareToToggle=false&indicatorsToggle=false&chartStyleToggle=false&state=8
SMAC Update 4 April 2023 Mkt Close -
ReplyDeleteThe SPX SMAC trend indicator has reversed and turned down after being up only 2 days.
W5000 SMAC continues to move down.
DJIA SMAC indicator still moving up marginally.
Because of the greater price volatility in DJIA recently on this rally the past 2 weeks and generally in its component stks, it is more prone to making false temp signals as this SMAC is based on price movement more that time.