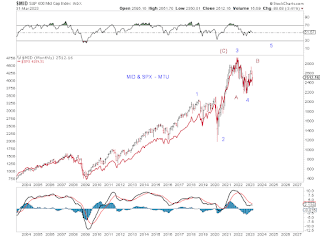
SPX is making another attempt at the resistance zone, from yet another higher low. A breakout is likely. The question is whether it is the middle part of a larger impulse (wave FIVE-up) or the ending part of a correction (wave B-up) - since key options regarding the larger structure have remained unchanged.
Disclaimer: Each post is for informational purposes only. It is not a solicitation, a recommendation or advice to buy or sell any security or investment product. Information provided in each post does not constitute investment advice.
Saturday, April 29, 2023
Saturday, April 22, 2023
Saturday, April 15, 2023
MTU Weekend Ed. - Back at the Zone (4/14/23 close)
SPX is back at its major resistance zone - a fifth attempt, with higher lows (Dec, Mar). Chart 1
Monitoring a potential triangle wave [b] in SPX if . This triangle does not work for other indices. Chart 2
Tracking counts for the upswing from the March low - for the triangle or further advance. Chart 3
Hard to say whether Friday's pullback is an impulse or an ABC structure. Chart 4.
Saturday, April 8, 2023
MTU Weekend Ed. - Short Term Update (4/6/23 close)
Short term - potential wave four-down
Structure - also in the process of confirming the right shoulder of a potential HS. The potential right shoulder right against the major resistance zone over the past 18 months .
Saturday, April 1, 2023
MTU Weekend Ed. - Tracking (3/31/23 close)
SPX is up 7.03% (dividend excluded) for the first quarter and back at the resistance zone (Chart 1).
A plausible bearish triangle since June 2022 is less probable since the Dow has exceeded its August high in December.
Chart 2 updates the tracking scenarios ( blue 5 and red Bs ).
Chart 3 presents squiggle counts.
Mid vs SPX, long term
MID vs INDU, since 2022


