INDU showing "better formed" waves. Here's the big picture since the Oct. low.

[340pm, EOD] Bull and bear counts -
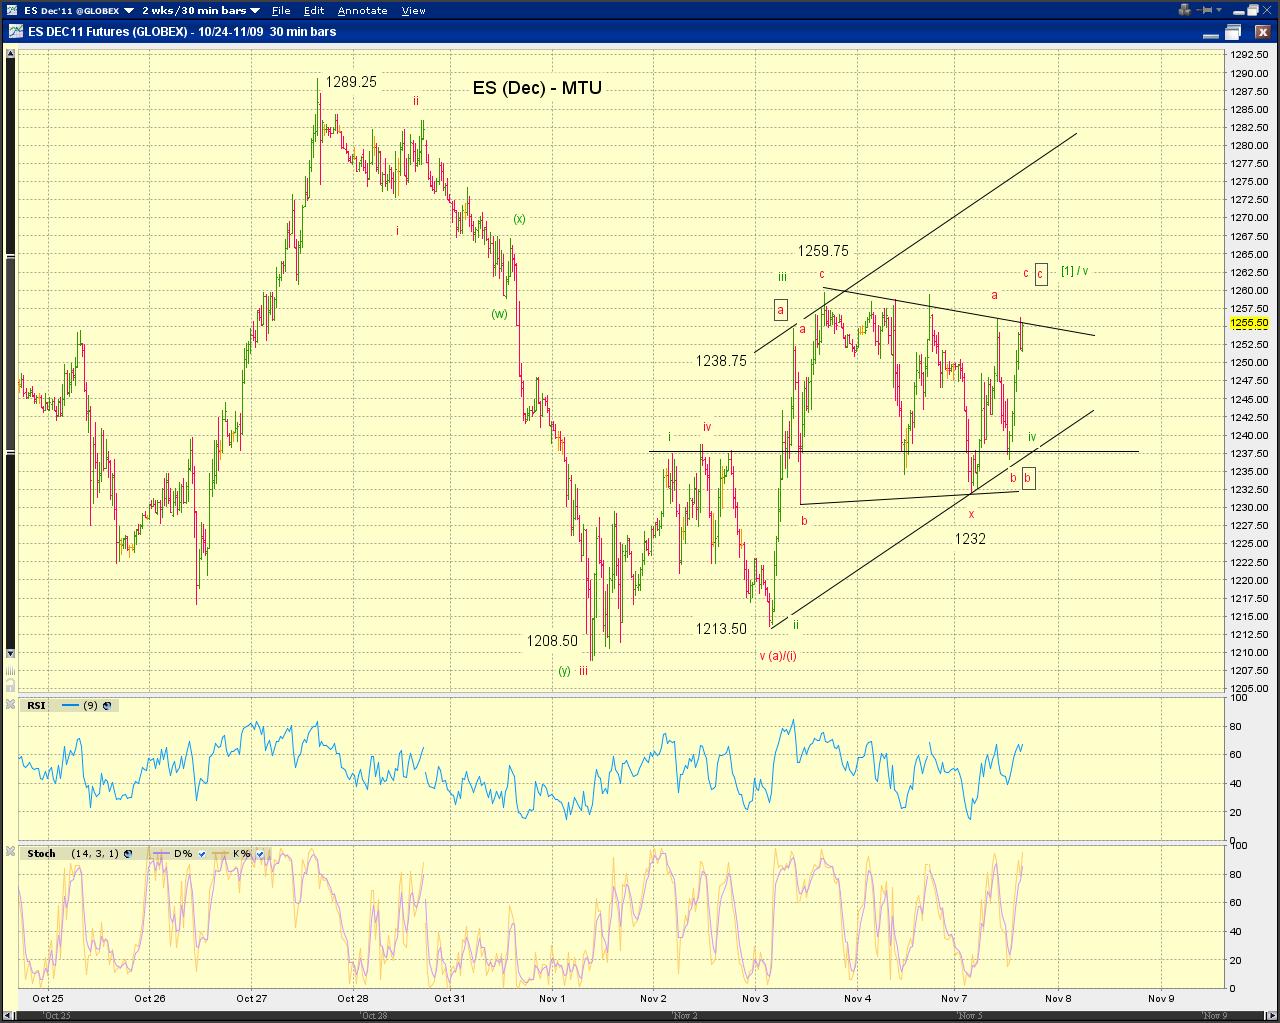
The structure in ES is telling. More after the close.
Bull - a tolerable five with a triangle 4th wave and minor overlap. Leave room for extension.
Bear - double zigzag (red), zigzag (boxed red)
Chart 2 shows the tracking squiggles on SPX cash.

[1140am] SPX update -
There are changes in the tracking counts as the market remains range-bound (see 835am entry). However, the wave structure is rich.

 [835am] ES update -
 Quite a turn-around from the AM low in ES. Multiple possibilities including the possibility of a truncated c*, a terminal triangle c** on the bearish side and a triangle [x] and a completed three x on the bullish side, all depending on which side of the congestion area ES breaks out.