Thursday, April 30, 2020

Thursday Update (4/30/20)

No much new to add.  Patience needed.  Monitor for overlap in Chart 2 to differentiate between [c] of 4 down and a new down wave.


Tuesday, April 28, 2020

Saturday, April 25, 2020

MTU Weekend Ed - Probing (4/24/20 close)

SPX continues to probe its 2018-19 support resistance zone with very mild reactions so far (Chart 1). Chart 2 updates near term tracking scenarios.

A long term chart of the Dow Jones Transportation Average

Tuesday, April 21, 2020

Tuesday Update (4/21/20)

SPX reacting to SMA50 and 2018-2019 resistance/support zone.  Near term squiggles and scenarios


Monday, April 20, 2020

Monday Update (4/20/20)

Here we go with the squiggles.  See the weekend update for all the squiggles might fit into the larger structure.


Friday, April 17, 2020

MTU Weekend Ed.- At Sup/Res Zone (4/17/20)

SPX closed inside the 2018-2019 support/resistance zone we highlighted last week and is forming a potential right shoulder (Chart 1)

SPX also closed above its 50-day SMA (Chart 2).  

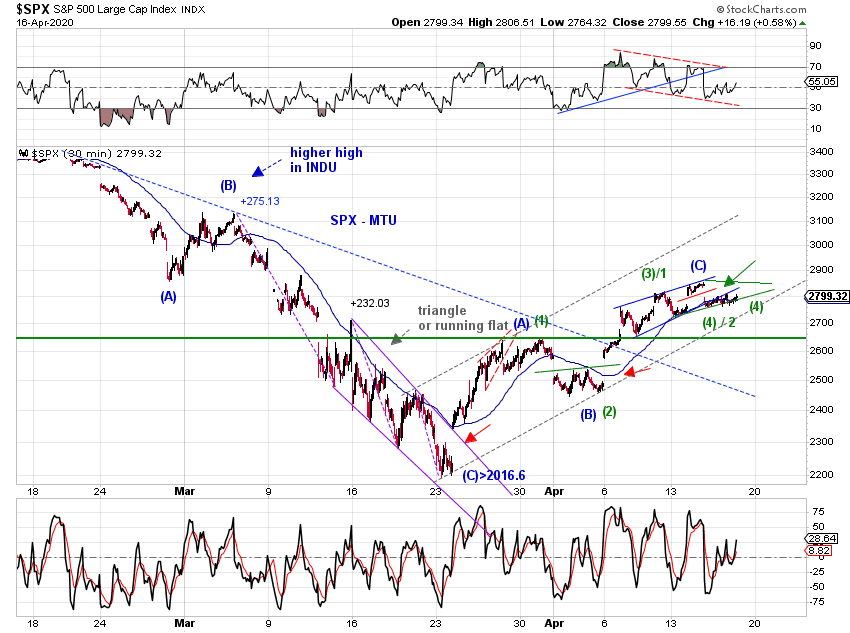
The larger structure is likely an (A)(B)(C) down from its ATH which took 23 days, and another (A)(B)(C) up from its March low which is in its 17th day  (Chart 2 blue).   

It is possible to count the upswing from the March low as an impulse (Chart 2 green).  We track it as an alternative scenario.

Chart 3 offers the squiggle counts for the corrective as sell as the impulse upswing.  Upside caps are also provided based on these counts.


SP400 long term - can map the count in SP500 since 2009 to MID 

Wednesday, April 15, 2020

Wednesday Update (4/15/20)

SPX reacted to the overhead resistance discussed in recent days.  Today's reaction was modest at best.

Tuesday, April 14, 2020

Tuesday Update (4/14/20)

Here we go

Multiple overhead for SPX
[1] SMA50 at 2892 
[2] potential small-degree EDT limit at 2882 (Chart 2)
[3] 2018-2019 sup/res zone at 2850 (this Chart)


Monday, April 13, 2020

Monday Update (4/13/20)

[EOD Update] -

Here we go. Please see the intraday update for squiggle.

[Intra-day Update-11:20am NYSE] -

Close call possibilities


Friday, April 10, 2020

MTU Weekend Ed - Approaching Sup/Res Zone (4/9/20 close)

SPX is at the 50% retracement level and is also probing the 2018-2019 support resistance zone, and may be forming a right shoulder (Chart 1).

The potential right shoulder EITHER could last a while in order to maintain spacial symmetry of the pattern OR could be very swift - 2 to 3 weeks drop to the neckline - in order to maintain the same time-ratio.

Chart 2 (ES) and Chart 3 (SPX) update our tracking counts.


Wednesday, April 8, 2020

Wednesday Update (4/8/20)

SPX retested the breakout and rose to marginal new high and closed near the high of the day but with negative divergence (Chart 1).

Regarding the larger structure, keep an eye on this potential wedge as it is possible to count the upswing as a series of threes (Char 2).

Also keep an eye on the declining daily SMA50 currently at 2919.


Tuesday, April 7, 2020

Tuesday Update (4/7/20)

Fast markets.  SPX broke out yesterday, met key resistance on the opening gap today and is attempt to retest the breakout.  In terms of time, this week marks 5-weeks down and 3-weeks up (Chart 1).

Is this it? Maybe maybe not  (Chart 2 and Chart 3).   Either way, key resistance holds or SPX needs to get over key resistance for any additional upside.


Saturday, April 4, 2020

MTU Month-End Ed. - Rebound (4/3/20 close)

SPX is rebounding but struggling to break above overhead resistance.  The first break out attempt this past week was not successful.  See Chart 1 ES, Chart 2 SPX.

The blue wave [4]-up remains possible, but perhaps with reduced likelihood.  The rebound high needs to hold AND we need to see an "immediate" sell-off that eventually breaches the low for [5]-down.  Otherwise, a retest of the low, if it occurs before moving higher, may be better counted as the purple (B)-down or the green (2)-down.  See Chart 3.  

Keep an eye on the potential larger structure (Chart 4).