[EOD]Stocks -
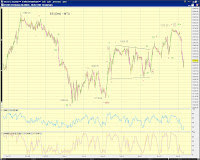
 At the end of the day, we have a 5-3-5 decline. Chart 1 shows the tracking counts and rough location of the potential bottom, including today's low.
 (Subjective) primary count remains wave X (blue), followed by wave 2 (green), followed by the bearish count (red).
[920 am] DAX and FTSE update -


[710 am] ES update -
Pullback to complete X-down of (B)/(2)-up likely has started overnight (Chart 1, ES). Technically, it's nice to see an EDT playing out once (in a long while) as discussed in yesterday's 340pm entry and this chart therein. As discussed, it's prudent to leave room for the larger bullish count with the overnight high being 1-up since the October low - better seen in INDU.
Squiggle count on ES since the November low is shown in Chart 2. The green bullish count is for entertainment purposes, if nothing more.

