If the decline from the February high in stocks represents a moderate correction, stocks have satisfied the minimum requirement for a bottom in terms of time, price and structure. However, confirmation of a low, a rise above the past week’s high, is still lacking.
Without such confirmation, the potential for the current decline to morph into a larger correction or a much larger sell-off remains.
The past week's high and low are key levels to differentiate the near term bullish and bearish possibilities.
A probable low
 The minimum requirement for a bottom has been satisfied in many indexes. Let’s use SP500 e-mini futures to illustrate this observation as key drivers of the recent market gyration are certainly global in a nature and not restricted to day sessions in the U.S. The appendix focuses on the Dow e-mini futures and the larger count.
Time - The recent decline has already lasted three weeks, which is at par with past corrections during the hope rally.
Price - If the recent decline corrects the advance since the November 2010 low, it has already exceeded the 0.236 fib level, is close to the 0.382 fib level and is in the territory of the previous 4th wave (Chart 1).
Structure – A simple A-B-C decline is visible on the daily chart (Chart 1). The blue count in Chart 2 offers an account of the proposed A-B-C corrective structure while the red count keeps track of the potential that the market has topped. Friday’s rebound is sizable and impulsive enough to suggest a probable low (Chart 3).
If the market makes a new low soon without meaningful additional recovery, but without the forcefulness commensurate with a 3rd wave down per the bearish count, wave C of the A-B-C corrective structure is likely extending.

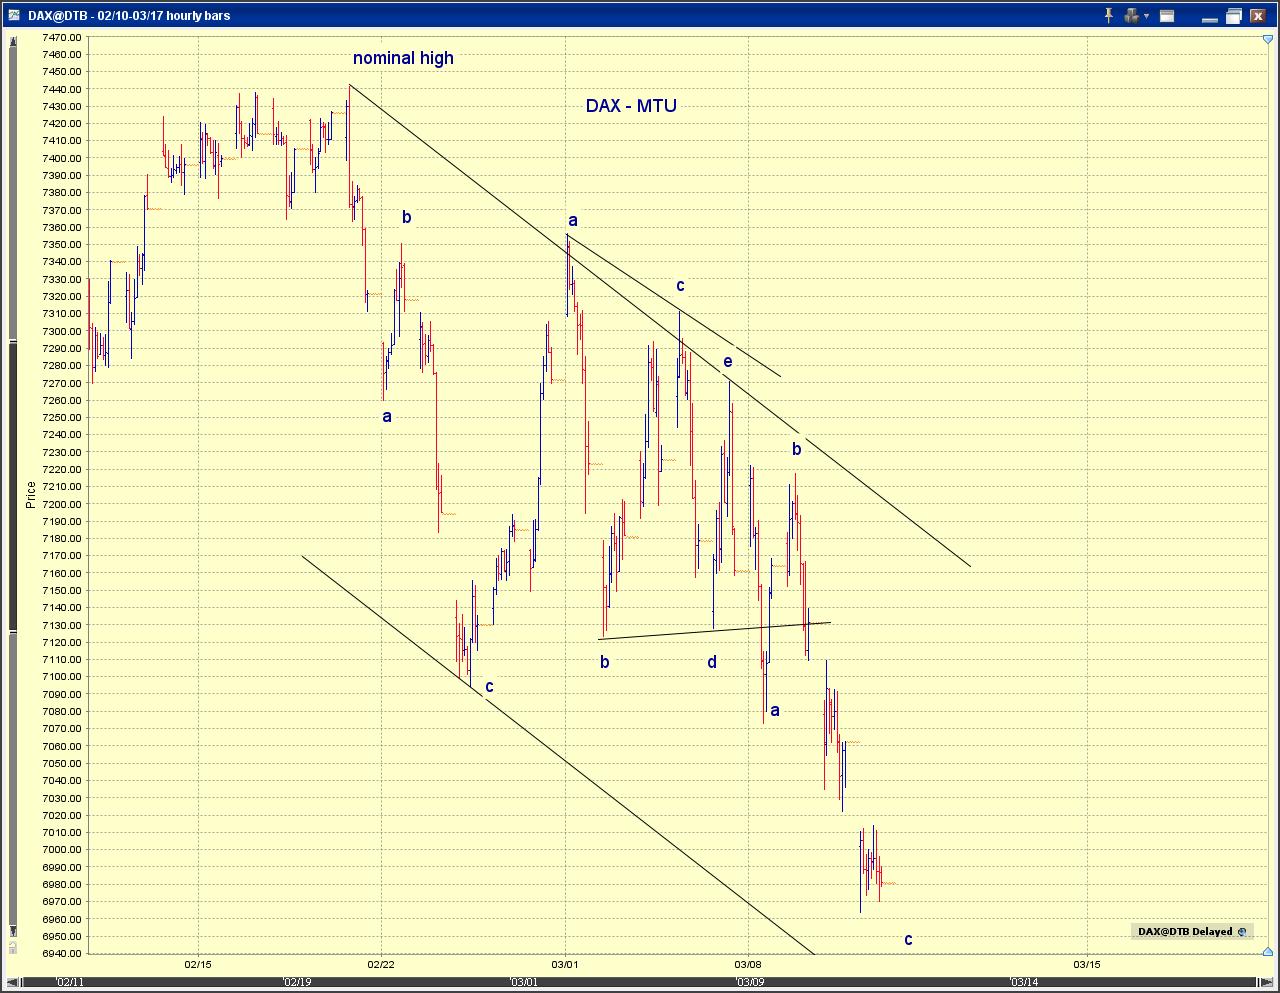
 FTSE and DAX update
The potential triangle in FTSE100 discussed in Europe Points the Way? (3/4/11) was invalidated by a decline to a lower low. However, a double zigzag structure (which is A-B-C in nature) is visible in both indexes (Chart 4 and Chart 5).

Appendix
 Judging from the Dow futures (Chart 1), which sports the "cleanest" wave structure,
[1-bullish count, blue] A corrective structure from the February high likely ended at Friday's low in the form of a zigzag with a triangle or a complex connecting wave.
Of a technical note, while it is visually possible to consider the possibility of a contracting ending diagonal triangle still being in progress (not shown) which requires one more push lower to complete the structure, there's no way to label wave iii of the EDT to be shorter than wave i of the EDT in YM (March). Thus, an EDT is less probable for the moment.
 Recent decline, which has already lasted three weeks, is likely the entire correction. If so, the correction can still be of minute degree (Chart 2, green).
If the market decides to morph into a more complex structure, Friday's low would be wave [a] of a downward flat or a combination three, or a "super lengthy" triangle. In this case, the correction is of minor degree (Chart 2, blue).
It's also interesting to note that the 50-day simple moving average line has been acting has support since the late August low.
[2-bearish count, red] The market is tracing out nested 1s/2s. This week's high should not be exceeded and a forceful push to lower lows should be seen next week.
Note that the market closed right at he middle of the bull/bear count confirmation levels Friday.