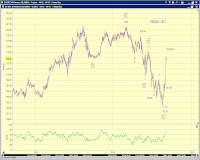
 No cigar for the bears so far. There were 7 waves down in ES from the (truncated) high but it did not morph into a nine.
So the one possible bearish count is an odd shaped nested [1][2](1)(2). See Chart 1 (red).
The other possible bearish count is an odd shaped LD i-down from the nominal high. See Chart 1 (bordered red). The spike up into and after the close fits the personality of a wave ii retrace of the LD.
The suspense continues.
While a double zigzag pullback appears to be a more natural count of the decline (Chart 1, blue),
the decline did breach the two most recent key levels to make life somewhat difficult for bullish counts.
 Hence it's not obvious how it fits into the larger count, except for the odd-looking ones (Chart 2).
[1] An extended wave iii or an extended wave v (green labels) with red count of wave (c).
[2] The start of a wave (iv) pullback of the advance since the late August low (blue labels). To be fair, this count has the best form among bullish counts.
Both of these bullish counts will likely squeeze the remaining space between the April high and yesterday's high uncomfortably hard if it is still a bearish minor wave 2 or B/(B).
One sees what one wants to see more often than not. So here's the long and short of it.