Thursday, March 8, 2012

Market Timing Update (3/8/12)

[EOD] Stocks -
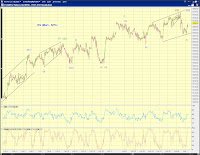
An examination of the rebound off the recent low shows a 5-3-5 recovery (Chart 1), which implies wave ii/(b)-up ended at today's high or a new impulse is to subdivide higher (Chart 2). Chart 3 to the right shows the larger count.


[1010 am] SPX update -
The focus is on the red (bearish 2/B-up) and green (bullish new impulse) counts. While still valid, the purple [iv]-up is effectively rejected. See 2nd chart below.
[730am] ES update -
Wave B, Wave 2 retrace or new impulse.


Wednesday, March 7, 2012

Market Timing Update (3/7/12)

[EOD] Stocks -
Chart 1 updates the larger count options - see yesterday's EOD update for discussion. Chart 2 updates the squiggle count for the rebound. Other than the bullish count (green), a potential post-triangle thrust up for a deeper 2nd wave rebound (red) or a potential EDT for a completed 4th wave rebound (purple). There could be some support for a 4th wave interpretation based on the wave structure in DAX (Chart 3 to the right).  We'll see what overnight action brings.


[215pm] SPX update -
Other than the bullish count (green), we are looking at a 4th wave (purple[iv]) or a 2nd/B wave (red 2/B) rebound with decent channeling characteristics. See yesterday's EOD update and chart 1 therein for the corresponding larger counts.


[850am] ES update -
see charts


Tuesday, March 6, 2012

Market Timing Update (3/6/12)

[EOD] Stocks -
Now that there is a meaningful pullback, we have following options (Chart 1). Chart 2 shows squiggle tracking counts which are fluid.


[bearish, purple] A larger trend change. The current decline is wave 1 or wave A down.
[somewhat bullish, green] Wave [iii] off the Nov low ended at point #9 green. The current decline is wave A of wave [iv]-down. Wave [iv] could be sideways or straight down as marked.
[bullish, red] Wave [iii] off the Nov low ended at point #9 red and wave [iv]-down has been in progress for a while. The current decline is wave (c)-down of [iv]-down, which is approaching its end.

In terms of odds, if SPX and NDX are roughly in sync (Chart 3), odds favor the bearish to somewhat bullish counts. Otherwise, the bullish count should be on the table.


[135pm] SPX squiggles -
updated squiggles, see 2nd chart below.
[11am] SPX squiggles -


[10am] SPX update -
Confirmation of a turn. SPX now entering the base of the prior expanding EDT based on the green count point #8. Potential initial support. See 2nd chart below.

[740am] DAX update -
One bearish way to count the DAX as a completed ABC recovery.


[710am] ES update -
Turning. [iv]-down or a larger trend change (Chart 1). Chart 2 shows various tracking color coded squiggles - nested 1s2s, ABC or LD/ED decline nearing completion. Also see yesterday's EOD update for more details.


Monday, March 5, 2012

Market Timing Update (3/5/12)

[EOD] Stocks -
A five wave advance since the December low most likely is complete. The market is either in wave [iv] off the November low (blue, Chart 1, ES) or beginning a larger down trend (red, Chart 1, ES) if we have an ABC structure. See Base Channel (3/2/12) for details.

In addition, one can also count a completed five wave advance since the November low in the cash SPX (Chart 2, purple).  The green and red counts in Chart 2 illustrate potential paths for a wave [iv] correction, whether of a sideways or a deeper pullback type.

The best bearish count places today's rebound as a 2nd wave off an LDT (Chart 3, purple).  Confirmation is lacking at the moment.


[11am] SPX update -
Higher degree counts. see 2nd chart below.
[10am] SPX squiggles -


[730am] ES update -
See the weekend commentary for details.


Friday, March 2, 2012

MTU Weekend Ed. - Base Channel (3/2/12 Close)

Update -  Breadth numbers within the SP500 index have finally been showing a multi-week negative divergence.  The following chart shows the advance-decline line for SP500 components.

Original post - 
SPX was up 0.28% this past week. While there are interesting bullish/bearish profiles in U.S. stocks' wave structures on the squiggle level or from a longer term perspective (see Chart 3 and Chart 4 in  Rolling Over (2/24/12)), the intermediate term picture points to a complacent market that is about to roll over.

intermediate term outlook
The impulse wave advance from at least the December 2011 low is wrapping up its final subdivisions (Chart 1, ES).  Wave labeling aside and despite the 2.5-month-long buy-the-dip mentality, SPX is yet to break free of various logical EW base channels.  This channeling feature lends some support to the possibility that the recovery since the October 2011 low is a corrective A-B-C structure.

Meanwhile, we emphasize again the observation made in Squeezed (1/27/12) and update the corresponding charts. "While the low levels of implied volatility has been justified by declining realized volatility, current VIX levels leave little margin of safety." (Chart 2) The 20-day realized volatility remains in a range where past major tops were made (Chart 3).


near term outlook
Chart 4 shows a potential final subdivision, likely a small-degree fifth wave, from the mid-February low in ES.  The blue count shows a completed regular five wave advance.  The red count shows a contracting ending diagonal triangle which could allow a final overthrow - capped at 1384 basis March e-mini.

Chart 5 shows the wave structure in SPX since its recent high on 2/29/12.  There are numerous possibilities subject to further development.  These possibilities are color coded.  The green count shows the most (immediately) bullish path with a small-degree wave 3/C already in progress.  The red count shows the most bearish path with a leading diagonal triangle decline off an orthodox high made on 3/2/12.


Market Timing Update (3/2/12)

[EOD] SPX squiggles -


[1110am] SPX squiggles -
many potential triangles, including terminal ones. See 2nd chart below.

[740] ES update -
see yesterday's EOD update for details.


Thursday, March 1, 2012

Market Timing Update (3/1/12)

[P.S.] ES -
With the after-hour action, ES offers interesting perspective.
(blue) topped/topping with (v)=(i)
(red) EDT, probably one more down-up subdivision, and capped by 1384
(green) bullish.

[EOD] Stocks -
Larger tracking counts are unchanged (Chart 1). There are several ways to count the near term action (Chart 2).
(purple - likely) Three-down and three-up. A potential flat decline. Fits the green [iv]-down in Chart 1. c-down of (a)-down of [iv]-down to follow.
(green - likely) Another leg of the upward sub-division towards the completion of green [iii], purple [v] in Chart 1.
(red - less likely) A truncated top at today's high. The small degree wave [4] is odd shaped and disproportionally large. But it's one of the top possibilities.


[1228pm] SPX squiggles -
bearish expanded flat follow up, see the 2nd chart below.
[1035am] SPX squiggles -
potential for a bearish expanded flat in the cash index, given the ambiguity in the prior decline.


[7am] ES update -
ES regained near term support at the black trend line (Chart 1), is poised to kiss the red trend line. There's potential for the rebound to be part of an expending EDT (blue, Chart 2) or something more bullish (green, Chart 2). The decline from yesterday's high is best counted as a three. The burden is on the bearish potential (1/2/1/2) to prove itself. It'll be interesting to see how the cash market opens.