Sunday, May 9, 2010

Overnight Futures Update (5/9/10)

[1015PM] Update on SPX mini after the announcement of the European Bailout Fund -
The labels on the squiggle count (right chart) are associated with
[red] An (a)-(b)-(c) fourth wave [iv] of 1-down of P3
[green] 1-down of P3 was complete on Friday with a truncated fifth wave. 2-up is in progress, and could be a upward or expanded flat. It looks like that [a] of 2 may be done.
[blue] The last leg of P2 in the form of 7 small degree waves up to a new recovery high is in progress.
Please see discussions in the weekend update A Primary Degree Top (5/7/10) for details.

Friday, May 7, 2010

MTU Weekend Ed - A Primary Degree Top (5/7/10 Close)

Odds strongly favor the April high in U.S. stocks as the end of this sharp bear market rally. Note that
[1] Thursday’s mini crash (nearly 1000 index points in the Dow in less than two hours, the unconfirmed trading glitch notwithstanding) and Friday’s follow through have demonstrated the underlying vulnerabilities in the market.
[2] The amount of complacency in the financial media after the crash and the forced and after-the-fact trade cancellations by exchanges – is it even legal? – raise the risk that this decline has legs.
[3] The broad market indexes have now dropped below their 2009 year end levels, wiping out the year-to-date gain for a second time in 2010, in just a few days.
[4] There’s a growing list of world stock indexes making lower lows, i.e. dropping below their February 2010 lows. For example, take a look at the Global Dow Index, Australia AORD, Shanghai SSEC, Paris CAC40, Italy MIB, Amsterdam AEX, Madrid IBEX, Switzerland SMI. In addition, the FTSE100 and SP500 are very close to breaking their February lows.

I highlight the three top scenarios (from a EWP perspective) that are applicable for the next few years, share my subjective preference, and invite the reader to assign his/her own probabilities.


Primary Count (very likely) – The selloff which had commenced in 2007 has resumed (or with less likelihood, will resume after a moderate near term higher high). Expect the coming phase of decline to be forceful and to draw markets to below March 2009 lows. Wave projections and classical head-and-shoulders pattern projections point to a bottom around 275 in SP500.

Chart 1 shows the larger picture where the coming phase of decline is primary wave [3] (or P3) of cycle wave c of super cycle wave (a) of grand super cycle wave [IV]. The bear market rally since the March 2009 low is primary wave [2] or P2.

Chart 2 shows a zigzag-(X)-zigzag-(X)-flat structure for P2, which places the P2 top at the April 2010 high.

Alternatively, but with less likelihood, P2 may be tracing out a large double three structure (Chart 3). If so, this bear market rally will climb in a 7-small-degree-wave structure to a final new high before topping. The February low (1044.50 in SPX) should not be broken under this interpretation.
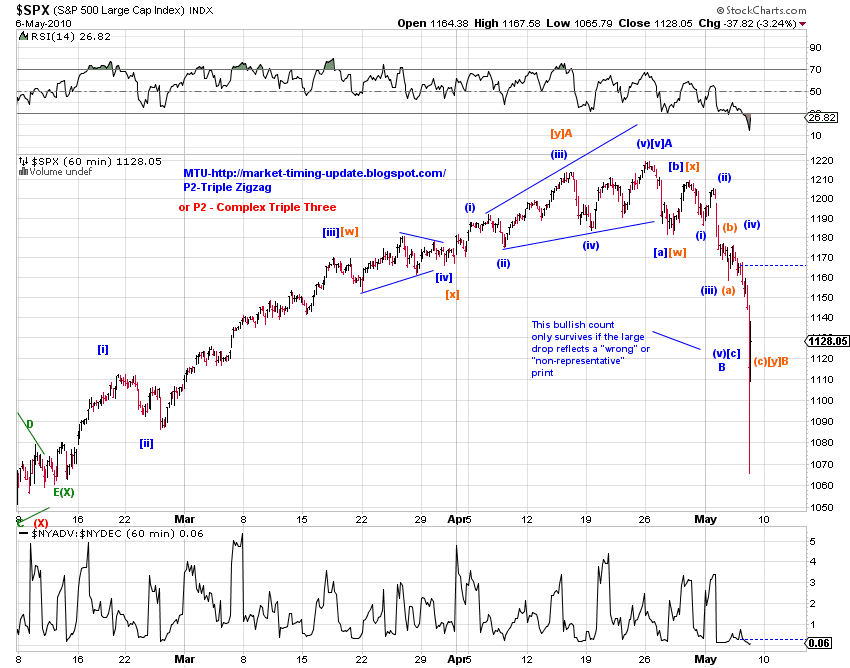

Chart 4(A&B) shows a detailed count of the intraday price action in SPX, which reflects the two possibilities discussed above.


Alternative Count (somewhat likely) – The March 2009 low will hold for the next 1 to 2 years, during which the market makes swings in a wide range before “crashing” down again. The advance since the March 2009 is likely to resume following a pullback which can potentially retest (or feels like retesting) the March 2009 lows. A new all time high is possible but less likely.

Chart 5 shows the larger picture where market has been in super cycle wave (b) of grand super cycle wave [IV] since March 2009. The current pullback is primary wave [B] of cycle wave a of (b).

Alternative Count (even less likely) – The March 2009 low marks the beginning of the final primary degree bull market of the grand super cycle wave [III], i.e. [5] of V(V)[III]. Expect the March 2009 low to hold and the market to march to new highs after the current pullback (as (2) of [5]) is complete (Chart 6).


Appendix-Additional Charts

Thursday, May 6, 2010

MTU-Bullish count if the U.S. market is still in P2? (5/6/10 Close)

What's the best bullish count if
(1) the market is still in the same primary degree advance, AND
(2) today's sharp decline is to be taken at face value (i.e. accept the print of a low of 1065.79 in SPX)?

The following bullish count may be a stretch from a number of angels, but it does not violate EWP rules and guide lines even on a squiggle level. And it is well defined in the sense that it will be rejected if SPX drops below today's low AND we can expect a number 7-wave sequence to new highs to conclude the bear market rally if this count is correct.

We'll know soon enough.

Chart 1 shows a complex three structure for the primary degree advance since last March.

Chart 2 shows a detailed count since the Feb low.

Market Timing Update (5/6/10 Close)

The sharp drop in stocks this afternoon - There have been reports / speculation that the sharp drop in stocks this afternoon was due to human error / erroneous trades and the corresponding market/automated-trading responses. If this is the case, today's low print may or may not be representative of where the market is / should be - from an EWP point of view or economics point of view. Given the development, bullish views and bearish views both call for additional thoughtfulness.

Both bullish and bearish counts remain valid if today's sharp drop is not representative - Chart 1 and Chart 2 offers the corresponding counts from the April 2010 peak. Regarding the bullish count, the wave-B correction most likely ended this afternoon.


The market has topped (P2, most likely) if one takes today's decline as is - P3 has started (Chart 2).

Wednesday, May 5, 2010

Market Timing Update (5/5/10 Close)

The preferred count is that today's low has the potential to be [w] of B under the correction scenario (Chart 2) OR i-down of (iii)-down under the P3-type scenario (Chart 3), mainly based on squiggle count that the rebound from today's low looks corrective (Chart 1).

Thus, a rebound is likely and there could also be a decent sized retracement, but expect additional downside action as [y] of B-down or iii of (iii)-down once the rebound is over, if this view is correct.

Tuesday, May 4, 2010

Market Timing Update (5/4/10 Close)

*** Just a correction? ***
The entire decline remains likely to be the final correction within P2. But if
[1] SPX drops below 1113.89, which will make the decline larger than the Jan-Feb correction, OR
[2] A large and clear wave structure develops that strongly suggests additional declines below 1113.89,
it will seriously challenge this minor degree bullish view. A drop below the 2/5/10 low (1044.50 in SPX) will outright invalidate this minor degree bullish view.

Chart 1 (SPX) and Chart 2 (RUT) present the corresponding wave counts and offer projections on how this correction may play out from a wave structure perspective.

Important EW hints on identifying the low under this interpretation:
The blue labeled count is the preferred count, which calls for a five wave decline from what is labeled as wave [b]. The market still has (iv)-up and (v)-down left on the minuette degree.

The red labeled count is the alt count (within the context of a general triple-three count of P2). This scenario only requires a three wave decline from what is labeled as wave [x] (or wave [b] for the blue labeled count). The low may be in or the market still has the iv-up and v-down left on the subminuette degree. See Chart 4 below for a squiggle count.

***Topped, a primary degree decline is starting? ***
The wave count in case that the market has topped is straight forward (Chart 3). Chart 4 offers a squiggle count of today's decline. A small degree fourth wave is most likely in progress.

Monday, May 3, 2010

Market Timing Update (5/3/10 Close)

Intra-day squiggle counts have been informative so far - see Chart 1 (SPX cash) and Chart 2 (SPX mini).

For minor to intermediate degree wave structures, please see Chart 2 and Chart 6 for SPX in Topped, Diverging Tops, or A Correction (4/30/10 Close).