Disclaimer: Each post is for informational purposes only. It is not a solicitation, a recommendation or advice to buy or sell any security or investment product. Information provided in each post does not constitute investment advice.
Friday, January 1, 2016
2016 Outlook (1/1/16)
Happy New Year!
Risk On, 2016
a. A potential fourth wave in stocks is likely to bottom in 2016
b. Key commodities are approaching their Fibonacci moments in 2016 for a potential low.
Stocks
Decennial Pattern and Presidential Cycle disappointed
U.S. stocks, as measured by the Dow Jones Industrial Average, lost 2.23% (excluding dividends) in 2015, disappointing the Decennial Pattern (Chart 1) as well as the Presidential Cycle (Chart 2).
An impulse wave advance from the financial crisis low still looks likely
From a long term perspective, we continue to grapple with the implication of an incomplete 2000-2009 pullback, and also with the wave degree. Chart 3 raises the following questions.
Did wave (4)-down end at the blue wave (4)? Does wave (4)-down require more time and price action as suggested by the red wave (4)?
Is wave 3 of (3)-up extending as tracked by the green labels?
Whether the 2009 bottom is part of the blue wave (4)-down or green wave [iv] of 3-up, the 2000-2009 and the 2007-2009 crashes alternate well with their respective second waves and are sizable enough in magnitude to satisfy minimum price requirements.
Odds appear to favor an impulse wave advance from the 2009 bottom (for example, as the green wave [v] of 3-up, or part of the blue wave (5)-up). Price structures since the 2009 bottom are not inconsistent with this bullish interpretation, at least not yet.
The propose wave (3)-up from the 1932 low in Chart 3 may fit into our tracking count on a very long term chart of stocks - the DJIA extended to 1789 as provided by Mkt Man. See Chart 4.
Momentum likely rules 2016
Within the propose impulse wave advance since 2009, U.S. stocks, as measured by SP500, are likely concluding a fourth wave decline which likely started in H2 of 2014 (Chart 4). Chart 4 presents our top three tracking scenarios.
Odds appear to favor the blue scenario, which tracks the proposed wave [4]-down as a triangle. A thrust down would complete wave C of (E), and thus wave [4]-down. See Chart 5. Wave [4]-down is likely to bottom in Q1/H1 of 2016, wave [5]-up should follow.
Commodities
Commodities approach Fibonacci moments for a low
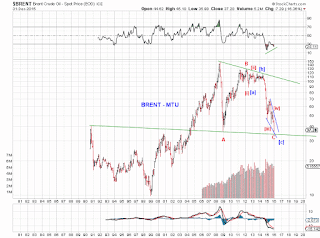
The year 2016 happens to be 8 years from the CRB index top as well as the Crude-Oil top. It is also 5 years from the Gold top. Key commodities are approaching their Fibonacci moments for a potential low.
The CRB Index retests its fiat currency bottom
The CRB index is likely wrapping an 8-year ABC pullback (Chart C1) towards its potential long term support which is the top of a 200-year range (Chart C2) and its fiat currency bottom. The 2015 low in CRB is 170.06.
Gold has retraced 50% of its 1999-2011 advance
A 5-year decline in Gold is likely concluding (Chart G1) with a potential 2-year EDT. If the proposed EDT plays out, Gold should bottom above 950.
From a long term perspective, Gold is likely getting ready for a meaningful rebound (as wave B or 2) or another advance to new highs. See Chart G2.
Crude oil is seeking a low with positive divergence
Crude oil is likely wrapping an 8-year ABC pullback (Chart O1) to retest potential long term support. Crude oil is seeking a low. Prices ended 2015 wedging with positive divergence.


