Stocks, Bonds, USD, Gold - key intermediate scenarios to watch
Stocks
Chart S1 summarizes three key scenarios to watch since the 2009 low in stocks, with the assumption that the advance likely traces out an impulse wave when done (see 2015 Outlook(1/2/15)).
[green - very bullish] Wave [3] ended at the turn of 2014 and wave [4] ended at the October 2014 low. See What if wave three ended a year ago? (1/9/15) The sell-off in January is wave (2)-down of wave [5]-up. Expect a wave (3) advance when wave (2) is complete.
[blue - bullish] Wave (5) of wave [3] is tracing out an expanding diagonal triangle. The sell-off in January is wave [b] of wave E of wave (5) of wave [3]. Expect a final wave [c] advance to conclude wave [3]. See Chart S2 for details.
An immediately bearish, but less likely, alternative under this interpretation is that wave [3] actually ended a the recent high in SP500 with a very short lived wave [c] of E(5)[3].
[red - bearish] Wave [3] ended at the turn of 2014 but wave [4] requires one final decline, likely targeting somewhere between 1800 and 1900 in SP500. The sell-off in January marked the beginning of this final decline.
Bonds
Chart B1 tracks two long term scenarios for the 10Y Treasury yield index.
[green] Yields bottomed in 2012 after a 30-year 13-wave decline. After rising to an initial high towards the end of 2013, the 10Y yield experienced a very deep pullback in the form of a double zigzag shown in Chart B2. In this case, expect U.S. long term rates to rise before long.
[blue] The decline since the 2007 high in yield is tracing out an contracting ending diagonal triangle. the final wave of the proposed EDT is in progress towards the lower blue trend line for an overthrow. In this case, expect U.S. long term rates to follow European rates lower.
USD
Chart $1 tracks two long term scenarios for the USD index.
[green] An upward flat has been in progress since the 2008 low in the USD index. Wave (B) of the upward flat ended at the 2011 low. The dollar index has now recovered half of its 2001-2008 loss. Wave (C) is either wrapping up its green wave 3 or in the middle of a very extended green wave 3. Chart $2 illustrates.
[red] An upward flat has been in progress since the 2008 low in the USD index. Wave (B) of the upward flat ended at the 2014 low, taking the form of a complex W-X-Y pullback. Wave (C) is now approaching equality with wave (A) and faces potential channel line resistance.
Gold
Gold, in USD terms, needs to clear the June 2014 high around 1350 to break above its two-year range. Otherwise, Gold remains susceptible to several bearish scenarios to conclude wave C off the 2012 high. See Chart G1.
[green C] expanding EDT off the March 2014 high.
[black C] a zigzag or a regular five-wave decline off the 2013-2014 contracting triangle.
[red C] final wave [e] of a large EDT dating back to the 2012 high.
Meanwhile, Gold priced in euro and yen faces potential lateral or trend channel resistance as shown in Chart G2 and Chart G3.
Disclaimer: Each post is for informational purposes only. It is not a solicitation, a recommendation or advice to buy or sell any security or investment product. Information provided in each post does not constitute investment advice.
Friday, January 30, 2015
Market Timing Update (1/30/15)
Thursday, January 29, 2015
Market Timing Update (1/29/15)
[EOD] Stocks -
This morning, stocks took the opportunity to register a low discussed in yesterday's EOD update. Let's see if today's low will hold before a new high. Chart 1 updates our near term tracking counts.
It should be helpful to review the structure of sell-off in SP500 so far. We note that
[1] From the all-time-high in December 2014, we have a visual three-wave decline so far. See Chart 2.
[2] From the Jan 22nd high, we have a visual seven-wave decline so far. See Chart 3. Today's low could also be a potential LDT/EDT from the red potential orthodox high in Chart 3.
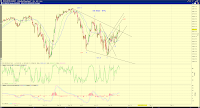
Note that 3 and 7 are corrective waves. Note also that LDTs tends to experience a deep retrace. Thus, the downward gap around 2050 is likely to be filled sooner rather than later.
[910am] ES update -
Wednesday, January 28, 2015
Market Timing Update (1/28/15)
[EOD] Stocks -
Tomorrow morning presents a window for a low, marked as the green (2), red (i) or blue [i] in Chart 1.
The potential for the green wave (2) low is based on the wave structure as well as time equality between green waves (1) and (2). In this case, wave (2) corrects much in time and less so in price.
The potential for the red or blue wave one is based on short term squiggles from the recent (potentially orthodox) high around 2060. Let's see if the market takes it.
Chart 2 show a version of the potential larger tracking counts.
[240pm] SPX update -
Watch the green trend line. See chart.
Tuesday, January 27, 2015
Market Timing Update (1/27/15)
[EOD] Stocks -
SP500 has delivered overlapping declines from last week's high so far (Chart 1). The green trend line appears important for the near term where today's low and close both retested (Chart 2). The downward open gap around 2050 remains unfilled(Chart 2).
[1025am] SPX update -
SP500 retesting the green trend line. See charts.
Monday, January 26, 2015
Saturday, January 24, 2015
MTU Weekend Ed. - Tracking 2015 (1/23/15)
While stocks have rebounded nicely this past week, the rebound may be the first advance of a new upswing or wave C of a bearish upward flat. As such, we continue to track the top scenarios outlined in Near Term Tracking (1/16/15). See Chart 1. As discussed before, these near term scenarios may fit into the particular long term tracking scenarios in Chart 2 with the assumption that wave [3] off the 2009 low ended about a year ago. See What If Wave Three Ended A Year Ago? (1/9/15)
To make progress, SP500 naturally need to break away from the sideways range of 1970-2095 it has experienced over the past two months. On the bullish side, a gap above the range around a third wave would be convenient. On the bearish side, a convincing rejection by the upper end of the range would be sufficient.
At the suggestion of our reader Mkt Man, we revisit the decennial pattern and the presidential cycle we discussed in 2015 Outlook (1/2/5) and examine how well 2015 has been tracking historical tendencies. We are able to make the following observations based on the Dow Jones Industrial Average back to 1915.
January 2015 has not been tracking the historical average price tendencies associated with year 5 of the decennial pattern, nor year 3 of the presidential cycle. Chart 3 and Chart 4 offer evidence.
To the extent that the rest of January is influenced by the historical average price behavior, both the decennial pattern and the presidential cycle suggest that next week can be (very) bullish. See Chart 3 and Chart 4.
Besides historical average price tendencies, we notice that price actions this year has been most correlated with January 1955 within our sample of years ending with a 5 and being the 3rd year of the presidential cycle. Note that 1955 is also the 3rd year of the presidential cycle. Chart 5 also suggests a bullish remainder of January.
At the moment, it may be a stretch to project the full year 2015 price action based on the 1954-1955 price profile. Based on the similarity in price actions between 1954 and 2014 and the January tracking (Chart 5), a longer term visual could be useful. See Chart 6.
Friday, January 23, 2015
Thursday, January 22, 2015
Market Timing Update (1/22/15)
[EOD] Stocks-
[855am] ES update-
ES trying to gap SPX above downward trend line on ECB announcements. Let's see if it can succeed. See charts.
[855am] ES update-
ES trying to gap SPX above downward trend line on ECB announcements. Let's see if it can succeed. See charts.
Subscribe to:
Posts (Atom)