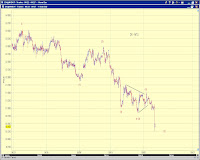
 [833PM] Futures update (ES)
If it is not a truncation (blue [2]), odds favor a pullback to lower lows.
[815PM] 10Y U.S. Treasury Yield
 Today's rally in bonds is most likely wave [C] of 2-down which corrects a wave 1-up leading diagonal. The correction does not look complete. A likely target is around 2.45% (or 24.5 on TNX).
[4PM] Stocks, USD Index, Gold
Stocks
 The larger-picture wave structure has become more discernible with additional price discovery in recent sessions. The two wave counts shown in Chart 1 address the difficulty in counting recent bars. The green count allows for a deeper pull-back and larger upside potential than the orange count.
Today's post-FOMC high is less likely to be the top ...
[1] The post-FOMC surge is best counted as a three rather than a five (Chart 2).
[2] An expanded flat or a triangle can accommodate the near term wave structure, including the sell-off into the close.
[3] Certain short term technical indicators are supportive.
 ... although a top is a probable scenario.
[1] We have a fresh high. And RUT has finally conquered its August high.
[2] The size of the orange v of (v) in Chart 1 is fib-friendly with that of the orange i of (v).
[3] It's possible to count an initial five down from the post-FOMC peak.
USD Index
Chart 3 updates the two top counts on the USD index.
At the end of the day session, one cannot exclude the bullish count for the USD index - the market does not make it easy. However, the bearish count is gaining tremendous momentum.
We now have a clear five down (from the recent top) that does not look complete and threatens to break the 80.085 low and reject the near term bullish count (Chart 4).


Gold
Gold is either marching towards the end of wave (iii) since the August low or OR in the middle of an extended wave (iii). See Chart 5 and Chart 6.

