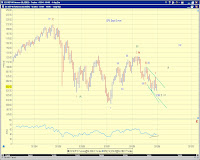
 [453PM] SPX cash index squiggles -
Showing the moderately near term bullish count, barring an extension. A regular five in the cash index, but a LD in the e-mini with i/iv overlap.
[4PM Stocks] Neither the high volatility nor the tight trading range is likely to persist much longer. The market has been extremely volatile - SPX has been running at a rate of 15+ point daily spread (high - low) over the past seven trading sessions, while being stuck in a about 40 point range and on low volume.
I'm either moderately to very bullish or very bearish :) for the near term but lean toward being moderately to very bullish at the moment given additional price actions this week.
 [1] Chart 1 presents the top counts. Today's low is
[1]-down of iii [i] 3 (1) P3 (red - extremely bearish) OR
[i]-down of 3 (1) P3 (black - moderately bullish) OR
[b]-down of 2 P3 (blue - very bullish)
For the moderately bullish and very bullish count, additional decline in the form of an extension could take place but is less likely.
[2] Chart 2 and Chart 3 present squiggle counts regarding the sell-off since the August high.
For the moderately bullish count (pink), the expanded triangle as wave iv of a LD [i]-down would reconcile the lower low in the cash index last Friday, and also offers no truncation for wave v-down of [i]-down.


 [3] Cycles points to a potential turning point this week (Chart 4). Since the market has been selling off into this week, the next turn if it comes true would be an uptrend.