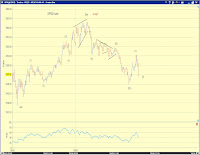
 First of all, let's get the bearish scenario out of the way (see the RED count in Chart 1). This P3 type bearish count is certainly credible and has been tracking the market well. It has the market in the middle of (iii)-down of [i]-down of 3-down of (1)-down of P3-down.
The bullish counts (see the BLUE count and the GREEN count in Chart 1) has today's pullback as a second wave correction to a fresh multi-day/week advance that started at yesterday's low.
First, we may have the squiggle count to support it, particularly with a bunch of triangles in the middle of the decline (Chart 2 -cash and Chart 3-futures).


Second, we may have inter-market "divergence" to support it. Note that small-cap indices, particularly the RUT, has delivered a shallower and more typical pullback today. In addition, the VIX and the rates market are not as risk-averse as the SPX today.
Third, there are no notable negative divergences on indicators, yet.
The line separating hope-based and analytical-evidence-based near term bullish view is firstly yesterday's low and secondly the July low.