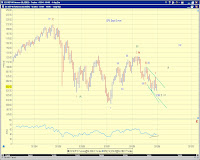
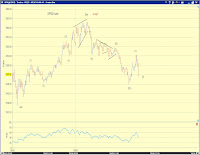
[453PM] SPX cash index squiggles -
Showing the moderately near term bullish count, barring an extension. A regular five in the cash index, but a LD in the e-mini with i/iv overlap.
[4PM Stocks] Neither the high volatility nor the tight trading range is likely to persist much longer. The market has been extremely volatile - SPX has been running at a rate of 15+ point daily spread (high - low) over the past seven trading sessions, while being stuck in a about 40 point range and on low volume.
I'm either moderately to very bullish or very bearish :) for the near term but lean toward being moderately to very bullish at the moment given additional price actions this week.
[1] Chart 1 presents the top counts. Today's low is
[1]-down of iii [i] 3 (1) P3 (red - extremely bearish) OR
[i]-down of 3 (1) P3 (black - moderately bullish) OR
[b]-down of 2 P3 (blue - very bullish)
For the moderately bullish and very bullish count, additional decline in the form of an extension could take place but is less likely.
[2] Chart 2 and Chart 3 present squiggle counts regarding the sell-off since the August high.
For the moderately bullish count (pink), the expanded triangle as wave iv of a LD [i]-down would reconcile the lower low in the cash index last Friday, and also offers no truncation for wave v-down of [i]-down.
[3] Cycles points to a potential turning point this week (Chart 4). Since the market has been selling off into this week, the next turn if it comes true would be an uptrend.
Disclaimer: Each post is for informational purposes only. It is not a solicitation, a recommendation or advice to buy or sell any security or investment product. Information provided in each post does not constitute investment advice.
Tuesday, August 31, 2010
Monday, August 30, 2010
Market Timing Update (8/30/10 Close)
[4PM stock] There have been overlapping waves for most of the day until the sell-off into the close. Chart 1 updates the top bearish and top short-term bullish counts. Chart 2 offers squiggle counts. See Looming Point of Recognition (8/27/10) for a detailed discussion.
Sunday, August 29, 2010
Friday, August 27, 2010
MTU Weekend Ed. - Looming Point of Recognition (8/27/10 Close)
Bottom Line
Stock market actions over the past three trading sessions offer new clues to the wave structure which suggest that additional upside for the current rebound is likely very limited. A significant sell-off is likely around the corner.
10-year Treasury note yield has entered the target zone (see The Bond Mania (8/20/10)). A trend reversal in the 10-year note (and possibly in long term UST in general) has likely started.
If this interpretation is correct, the outstanding question is how to reconcile the anticipated sell-off in both stocks and bonds at this “early” stage of P3-down. A potential explanation is “the point of recognition of a cycle degree decline.” While the orthodox point of recognition under the P3-down scenario is wave 3 of (3)-down, wave 3 of (1)-down could be forceful enough to accelerate the recognition process.
Here’s one way markets might develop. One of my tracking scenarios marks last Wednesday’s low as wave [i]-down of 3 of (1)-down (gray labeled count in Chart 1). Wave [ii]-up may take SPX to the 1080-1100 area and allow time for bonds to complete a decent-sized first impulse wave within the new trend.
(Note that additional rebound in stocks is not required as the rebound can be considered complete short of a squiggle high and one of the other tracking scenarios marks last Wednesday’s low as wave (i) of [iii]-down of 3 of (1)-down (red labeled count in Chart 1).
As stocks sell off again (as wave [iii] of 3 of (1)-down), bonds rally but will not be able to recover all the lost ground. Recognition soon comes as the sell-off in stocks accelerates and “the bond bubble bursts.” It could be wishful thinking at the moment as alternative scenarios do exist (Chart 1, Chart 2 and Chart 3), but it’s definitely prudent to respect the risk.
“Evidence” in stocks – due diligence on readers’ part required
The wave structure over the past three trading sessions is most likely corrective (Chart 4). If this is the case, the likelihood of the blue-labeled count in Chart 1, which allows SPX to rise above the August high, is greatly reduced. Friday’s lower lows in many cash indices also reduce the likelihood of a larger triangle highlighted in Chart 2. This leaves the top counts squarely in the more bearish camp (gray and red labeled counts in Chart 1).
The rebound could even be considered complete (short of a squiggle high). A continued rebound (in the form of a likely double three) is unlikely to push SPX beyond the 1080-1100 area.
A potential reversal in 10-year Treasuries
Chart 5 and Chart 6 update those highlighted in The Bond Mania (8/20/10). Note that Friday’s reversal comes within a day of a potential turn-date as highlighted in Chart 6. Please see The Bond Mania (8/20/10) for a detailed discussion of the long term trend in U.S. interest rates.
Thursday, August 26, 2010
Market Timing Update (8/26/10 Close)
[4PM Stocks] This update will focus on how to see today's action as being "bullish".
First of all, let's get the bearish scenario out of the way (see the RED count in Chart 1). This P3 type bearish count is certainly credible and has been tracking the market well. It has the market in the middle of (iii)-down of [i]-down of 3-down of (1)-down of P3-down.
The bullish counts (see the BLUE count and the GREEN count in Chart 1) has today's pullback as a second wave correction to a fresh multi-day/week advance that started at yesterday's low.
First, we may have the squiggle count to support it, particularly with a bunch of triangles in the middle of the decline (Chart 2 -cash and Chart 3-futures).
Second, we may have inter-market "divergence" to support it. Note that small-cap indices, particularly the RUT, has delivered a shallower and more typical pullback today. In addition, the VIX and the rates market are not as risk-averse as the SPX today.
Third, there are no notable negative divergences on indicators, yet.
The line separating hope-based and analytical-evidence-based near term bullish view is firstly yesterday's low and secondly the July low.
Wednesday, August 25, 2010
Market Timing Update (8/25/10 Close)
[1145PM]ES after hours squiggle update -
[4PM stocks] The bullish count would have this morning's low as [b] of 2-up or D of a large triangle as the blue and pink labeled counts in Chart 1 and Chart 2 indicate. Please see yesterday's EOD update for additional discussions of these tactical contingencies.
The bearish count would have today's rebound as iv-up of (iii)-down or (iv)-up, as the gray labeled count indicates in Chart 1.
However, the rebound today has traced a decent five with nice alternations (Chart 3). This lend support to the bullish counts AND the notion of wave (iv) instead of iv.
Under the bearish count, if today's rebound (a five) is wave c of and expanded flat, wave (iv) is done - otherwise, today's rebound is wave A of (iv).
Under the bullish count, today's rebound is the first leg of a multi-day/week advance.
Tuesday, August 24, 2010
Market Timing Update (8/24/10 Close)
[11PM] All you can squiggle -
* the larger picture -
* the current sell-off -* bottom fishing -
[7PM] More tactical contingencies - Here are the SP500 cash index charts.
Chart 1 - Two counts under P3. These are the same counts discussed in the [4PM update]on the E-mini.
Chart 2 - A potential triangle in progress within the context of a larger [X]-wave, a(B)-wave, or a P2-down (long term bullish).
Naturally, a triangle would describe the range bound market over the past few months well. In addition, a triangle at the moment tracks "all" indices -SP500, COMPQ and RUT.
[4PM Stocks, Euro, Gold] Tracking two bearish and two bullish near term counts currently - all within the context of a larger bearish trend (Chart 1).
The bearish counts are labeled in red. The difference between the two is where (i)-down of 3-down ends. The more bearish count has (i)-down already complete in a nested 1s2s formation. The less bearish one has (i)-down as a LD yet to be completed.
The "bullish" counts are labeled in blue and in bordered pink. The chart should be self-explanatory. The current decline is wave [b]-down of 2-up. Dropping below the July low will invalidate this interpretation.
Chart 2 offers a squiggle count of the SP500 cash index. Unless we have a truncated wave C as indicated (which is less likely in my view), this rebound is likely to take extra time as well as price to complete.
If the recent decline in Euro is a corrective ABC structure, Euro is approaching support and a rebound (as C of (2) or something a lot more bullish) is likely. Chart 3
Gold appears to be in the middle of a fifth wave advance at multiple degrees or an extended small-degree 3rd wave. A new high is in sight if this is the case. Chart 4
Monday, August 23, 2010
Market Timing Update (8/23/10 Close)
[9PM Stocks] New low in ES.
[4PM Stocks] The two larger time frame wave counts discussed in the weekend update are tracking today's market action well (updated in Chart 1 and Chart 2).
It's prudent to leave room for the near term bullish (tactical contingency) count. In the SP500 cash index, a nice 5-wave rebound from Friday's low ended at today's high. What followed is a zigzag decline into the close (Chart 3).
Saturday, August 21, 2010
MTU Weekend Ed. (Bonds) - The Bond Mania (8/20/10 Close)
The Bond Mania
Since long term Treasury yields had topped in 1981, bond yields have been in a secular decline over the next 30 years.
Despite the recent rally fueled by QE2-lite and QE2 front-running, the secular bull market in bonds very likely has already ended in late 2008.
If this is the case, the 2010 bond rally represents the first major cyclical correction in a new secular bear market for bonds. The initial stage of this new secular bear market could be driven by either reflation or a bursting of the bond bubble.
I’ll explore the secular rally and the budding bear market in bonds from a EWP perspective below. There are plenty of the insightful discussions involving economic fundamentals, policy and bond market technicals in the public domain.
A Long Term Perspective
Chart 1 presents three credible wave structures in the 30-year bond price, all of which point to an end to the bond mania in late 2008. There are two ways to count the secular bull market in bonds as being corrective and one way to count it as a completed impulse wave.
[Black- a large generic corrective wave] If one simply counts the number of higher highs and higher lows since the 1981 low in bond prices, one would arrive at 11 waves without having to bother with the exact labeling of this structure. Conveniently, 11 waves represent a corrective structure according to EWP. I have identified the structure for each segment of these 11 waves in Chart 1.
[Blue- a triple three ending with a diagonal triangle] The labeling for this count in Chart 1 is self-explanatory. Note the alternation between the two [X] waves, the first one being a flat and the other one being a zigzag. The implication of an ending diagonal is a sharp sell-off to the base of the ED, around $75 in this case. So expect bond prices to be cut in half if this is the case.
[Green- a completed impulse wave, ending with a diagonal triangle] The labeling for this count in Chart 1 is self-explanatory. Note the alternation between wave (2) and wave (4), with wave (2) being a zigzag and wave (4) being a triangle. Under this count, wave (5) is the ending diagonal, which implies a sharp sell-off to the base of the ED, around $75 in this case. So expect bond prices to be cut in half if this is the case as well.
Near Term Outlook – close to a turn
I’ll focus on the 10Y note yield regarding near term outlook, despite the fact that it belongs to the most “structurally manipulated” area by the N-th QE. The choice is a challenging one but relevant at the same time.
On the 10Y note yield, Chart 2 shows that the sell-off between late 2008 and Q2/2010 is a decent five-wave structure, and the subsequent rally is best counted as a zigzag (A)-(B)-(C) correction. The market is likely approaching the end of this correction – note that (C)=(A) at about 2.5% for the 10Y and the next potential turn date is within two weeks.
Chart 3 and Chart 4 zoom in on the daily and hourly wave structures to support the notion that an end to the rally is in sight. If wave [5] of 5 of (C) does not extend (which is a lower likelihood scenario), the bottom in yield is already in.
Friday, August 20, 2010
MTU Weekend Ed. (Stocks)- Tactical Contingency (8/20/10 Close)
Bearish interpretation is on track
The bearish count has been tracking the market well. From the April high, minor wave 1-down ended at the May low. Minor wave 2-up took the form of a flat and ended at the August high.
The sharp reversal down over the last two weeks is wave (i)-down of [i]-down of 3-down. Regarding the wave degree, last Friday’s low could be one degree larger as [i]-down of 3-down. See the red labeled count in Chart 1 and Chart 2.
Wave (i)-down (or wave [i]-down) most likely was complete at Friday’s low. After a brief second wave rebound to about 1100 in SPX, a strong wave (iii) of [i] of 3-down (or wave [iii] of 3-down) is likely to be range-busting and push the market beyond its July low.
* SP500 E-mini
Near term bullish tactical contingency
However, Friday’s low ended with notable technical divergence and the sell-off since the August high has not been as swift as one would expect from an assumed ending diagonal from the July low to the August high.
Thus, from a risk management perspective by strategic bears and near term positioning by tactical bulls, it is important to leave room for near term bullish possibilities.
The most credible near term bullish count is the one that has minor wave 1-down complete at the July low in the form of a large leading diagonal. Minor wave 2-up may still be in progress and the recent decline is only wave [b]-down of 2-up. Minor wave 2-up will eventually advance beyond the June and the August highs. See the blue labeled count in Chart 1 and Chart 2.
Wave [b]-down is likely an expanded flat, which most likely ended at Friday’s low. Thus, Friday’s low is a key level to monitor.
In addition to the positive divergence seen at Friday’s lows, this bullish contingency count can accommodate the wave structure in SPX futures, SPX cash index, the Nasdaq indices and the Russell 2000 index and brings these indices in sync with each other in terms of their wave counts. (See Chart 3, Chart 4 and Chart 5)
* SP500 Cash, Compq, RUT
Appendix - Building on a small five up into the close and the after hours pump.
Intraday Update (8/20/10)
[250PM] SPX/mini count update- Now there's enough squiggle to start a "bullish" count - see if it plays out.
[1206PM] SPX/mini count update - no change in the larger count. A potential ED may have just completed i-down (bearish) or [x]-down (bullish).
[730AM] SPX/mini overnight update -
A fresh low in the SPX e-mini completing a nice 5-wave down since the Aug 18th high. The following charts updates the bearish and near term bullish counts.
The bearish count has wave i of (iii) of [i] of 3-down approaching its end. After a brief bounce up, expect a forceful iii of (iii) sell-off.
The near term bullish count has wave [x]-down of 2-up approaching its end. Expect [y]-up of 2-up to carry the market to above June and August highs. Note the positive divergence on the 60min chart as well.
[1206PM] SPX/mini count update - no change in the larger count. A potential ED may have just completed i-down (bearish) or [x]-down (bullish).
[730AM] SPX/mini overnight update -
A fresh low in the SPX e-mini completing a nice 5-wave down since the Aug 18th high. The following charts updates the bearish and near term bullish counts.
The bearish count has wave i of (iii) of [i] of 3-down approaching its end. After a brief bounce up, expect a forceful iii of (iii) sell-off.
The near term bullish count has wave [x]-down of 2-up approaching its end. Expect [y]-up of 2-up to carry the market to above June and August highs. Note the positive divergence on the 60min chart as well.
Thursday, August 19, 2010
Market Timing Update (8/19/10 Close)
[1120PM] Pushing one version of the bullish count further, here are the squiggles.
If this is the case, the deep wave (ii) retrace has certainly done its job in terms of its magnitude as well as its impact on sentiment. We'll see what happens in overnight trading.
[4PM] I want to take a step away from the squiggles and focus on the larger time frame count.
Obviously, the bearish count is that 3-down or (C)-down has started last week, per the grey labeled counts in Chart 1 (SPX) and Chart 2 (RUT).
The bullish count has 2-up or (B)-up still in progress, with the added benefit of bringing the counts in SPX and RUT in sync. Awareness of this possibility should be helpful in risk management by strategic bears or short term positioning by tactical bulls.
These near term bullish counts are highlighted by the blue and pink labeled counts in Chart 1 (SPX) and Chart 2 (RUT). Also note the positive divergences on these charts.
Subscribe to:
Posts (Atom)