Saturday, June 29, 2013

Monthly Outlook Update (6/28/13)

Stocks, Bonds, Dollar, Gold

Stocks
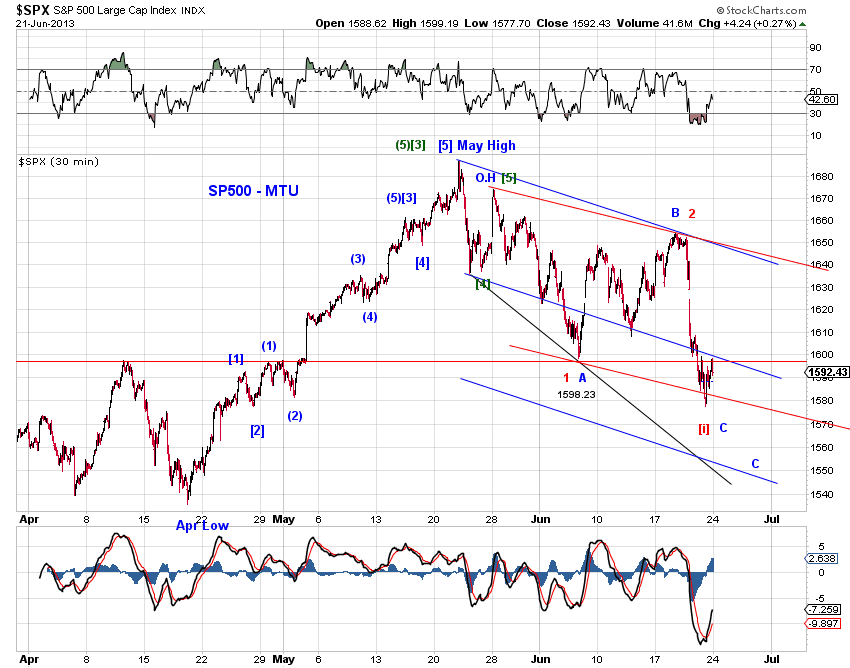
The 7.5% sell-off from the May high in stocks appear largely corrective (Chart 1).  As a result, we maintain the primary counts of


[1]  a wave (4) pullback with respect to the 2011 low.  The proposed pullback is likely complete at the June low (Chart 2 blue).  The red count in Chart 1 offers an alternative where wave B is still in progress as a flat or triangle, to be followed by wave C-down to a moderate lower low. 

[2]  a deeper wave (D) pullback within a diagonal triangle since the 2009 low (Chart 3).  In this case, the wave (D) sell-off can be reasonably deep (to about 1430 which is 15% off the May high) and can lead to widespread bearish sentiment. 

At the same time, we continue to track the bearish count of a resumed bear market (Chart 2 red) given its relevance and potential impact.  We observed in Post-FOMC Update (6/21/13) that "Since this past week’s crash has eliminated one of the logical places, the May high is now one of the two final logical termination points of the Hope Rally."

The wave (D) decline of the proposed diagonal triangle is likely as powerful as the initial sell-off of a bear market.  The difference is that the former terminates and the latter is lasting.

Bonds
Bond yields surged in June partly in response to risks of the Fed's tapering its QE (Chart 4).

10-year U.S. Treasury yield is now approaching a technical resistance zone in a three-wave rise off its all-time low in 2012 (Chart 4, trend line).   The initial impulse wave upswing in 2012 (Chart 5, red [a], green [i]) now conveniently serves a Fibonacci division (0.382 to 0.618) of the distance between the 2012 low and the June high.  Also note that wave counts in Chart 5 suggest that the upswing in yields over the past year is either a flat or a [i]/[ii]/(i) sequence. 

As such, we see no need to alter the long term tracking counts in Chart 4.


USD
The USD index dipped slightly below its April/May low in June but has quickly rebounded and is yet to surpass its May high (Chart 6).  As a result, there's no need to alter our short term and long term tracking counts (Chart 6 and Chart 7).  See prior monthly outlook updates for discussions.


Gold
We have been tracking gold with a fourth wave pullback since its 2011 top. With another plunge during the month of June, the proposed pullback is approaching a fib-0.5 retrace and its 2-year anniversary in late August (Chart 8).  Potential targets for the low are the June low, 1150, 1125, 970.

The potential for a corrective (4th wave) pullback has support from the wave structure of Gold priced in Japanese Yen (see Monthly Outlook Update (4/26/13)) which sports a potential expanded flat (Chart 9). 


Under the three near term tracking counts discussed in Monthly Outlook Update (5/31/13), we label the June low in Gold as
[red] wave 3 of (C),
[blue] wave [iii] or [v] of an extended wave 5 of (C),
[green] wave 5 of (C) out of a triangle  (Chart 10).  This count indicates the low is at hand or imminent.


Friday, June 28, 2013

Market Timing Update (6/28/13)

[EOD] Stocks -
It's likely that we have a failed small-degree 5th wave today, barring an extension of the proposed 5th wave. See charts.


[1150am] SPX update -


[725am] ES update -
Month end. Please note the green B-flat count in Chart 1. It's prudent and logical for shorts to set stops at the May high rather than the June high, and for longs to set stops at the June high.


Thursday, June 27, 2013

Market Timing Update (6/27/13)

[EOD] Stocks -
Most likely, the market is in the process of a wave (iv) or wave 2/B retrace (Chart 1 blue), which also implies that one can count a completed zigzag from the low (Chart 1 red). Chart 2 shows how the squiggles fit into the larger structure.


[2pm] SPX update -
squiggles from the low.


[8am] ES update -


Wednesday, June 26, 2013

Market Timing Update (6/26/13)

[EOD] Stocks -
SPX has approached the fib-0.5 retrace of the recent plunge (Chart 1). This is a logical area to conclude the red (ii) upswing if it is one. The rebound from the low can be counted as a complete zizag (Chart 2, red). Bullish counts place the current high as the green wave (iii) or the blue wave iii of (iii). A retest of the 1590 area (blue line) appears likely.


[720am] ES update -


Tuesday, June 25, 2013

Market Timing Update (6/25/13)

[350pm] SPX update -
The rebound is so far three waves in ES . SP500 is at the blue channel line and fib-382 resistance. Squiggle count suggests a nested 1s2s or an ABC upswing. See charts.


[120pm] SPX update -


Monday, June 24, 2013

Market Timing Update (6/24/13)

[EOD] Stocks -
A near term bottom is likely in place at the day's low, which counts as (4)-down / W of (4)-down (Chart 1-blue) or (i)-down of (iii)-down (Chart 1-red). See Post-FOMC Update (6/21/13) for analysis of the big picture. Chart 2 updates


Squiggle count shows a reasonable five-up from today's low. See chart 3.


[1020am] SPX update -


[7am] ES update -


Saturday, June 22, 2013

MTU Weekend Ed. - Post-FOMC Update (6/21/13 Close)

Over the past month, we have been tracking three scenarios for the sell-off in stocks from their May top.

[---1---] A small degree 4th wave decline with respect to the Nov 2012 high. The post-FOMC crash eliminates this scenario.

[---2---] A 4th wave pullback with respect to the 2011 low (Chart 1-blue). The corresponding bull market count variations are a 4th wave pullback with respect to the 2012 low (Chart 2-green, a shallow correction) or wave D /4 decline with respect to the 2009 low (Chart 3, a deeper correction).

As we have discussed in recent weeks, a 4th wave pullback with respect to the 2011 low (Chart 1-blue) appears the most likely scenario and the proposed 4th wave is likely to move in a sideways triangle to consume time or decline towards 1550 in SP500 (See Short Term Update (6/14/13), Tracking Update (6/7/13), Bull or Bear (5/24/13)).


Indeed, the post-FOMC crash has sent SP500 to 1577.70 this past week or 6.5% below the May top. The moment of truth with respect to this view is approaching. Note that this past week’s low is just 1.61 index points above the 2007 top. Hence, the recent sell-off can be viewed as a typical retest of the breakout area if the Hope Rally has any life left in it (Chart 4).

Chart 5 tracks the near term structure of the sell-off from the May top. The blue count tracks a flat-like structure approaching its end. The red count tracks the bear market scenario in a series of first and second waves.


[---3---] The start of a post-Hope Rally bear market (Chart 1, red). This scenario is important given its outsized reward/risk trade-off and our prior assessment that the May high is one of the three final logical termination points of the Hope Rally.

Since this past week’s crash has eliminated one of the logical places, the May high is now one of the two final logical termination points of the Hope Rally.

If a continued sell-off becomes deep enough or future logical pivots get violated, this bear market count will become the front runner along with the bullish diagonal triangle count (Chart 3) which calls for a deeper pullback.


Friday, June 21, 2013

Market Timing Update (6/21/13)

[320pm] SPX update -
Larger structure and squiggle count ahead of weekend position management. See charts.


[815am] ES update -


Thursday, June 20, 2013

Market Timing Update (6/20/13)

[EOD] Stocks -
First of all, Chart 1 and Chart 2 present our bullish and bearish tracking since the 2009 low to put the current downswing into perspective. The bullish view(short term or long term) places the market at a fourth wave of certain degree. The bearish view (long term) sees the Hope Rally over at the May top.


Next, the post-FOMC crash has roughly reached equality with the initial sell-off from the May high.  The current downswing is wave C by the corrective tracking and wave [i] of 3 by the impulse-wave tracking as the decline is not sizable enough to call it a wave 3. See Chart 3 and Chart 4. 


Finally, squiggle counts in SPX and ED place the market at the end of an impulse or wave 3 of that impulse barring endless extension. See Chart 5 and Chart 6.


[1055am] SPX update -


[805am] ES update -
The larger structure and squiggle counts.