[---1---] A small degree 4th wave decline with respect to the Nov 2012 high. The post-FOMC crash eliminates this scenario.

As we have discussed in recent weeks, a 4th wave pullback with respect to the 2011 low (Chart 1-blue) appears the most likely scenario and the proposed 4th wave is likely to move in a sideways triangle to consume time or decline towards 1550 in SP500 (See Short Term Update (6/14/13), Tracking Update (6/7/13), Bull or Bear (5/24/13)).


Indeed, the post-FOMC crash has sent SP500 to 1577.70 this past week or 6.5% below the May top. The moment of truth with respect to this view is approaching. Note that this past week’s low is just 1.61 index points above the 2007 top. Hence, the recent sell-off can be viewed as a typical retest of the breakout area if the Hope Rally has any life left in it (Chart 4).
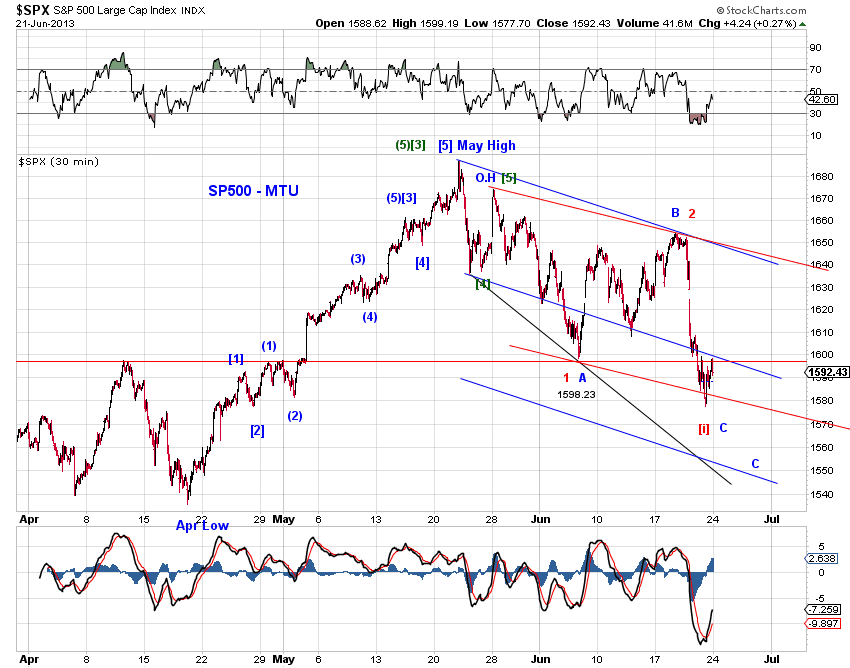
Chart 5 tracks the near term structure of the sell-off from the May top. The blue count tracks a flat-like structure approaching its end. The red count tracks the bear market scenario in a series of first and second waves.

[---3---] The start of a post-Hope Rally bear market (Chart 1, red). This scenario is important given its outsized reward/risk trade-off and our prior assessment that the May high is one of the three final logical termination points of the Hope Rally.
Since this past week’s crash has eliminated one of the logical places, the May high is now one of the two final logical termination points of the Hope Rally.
If a continued sell-off becomes deep enough or future logical pivots get violated, this bear market count will become the front runner along with the bullish diagonal triangle count (Chart 3) which calls for a deeper pullback.