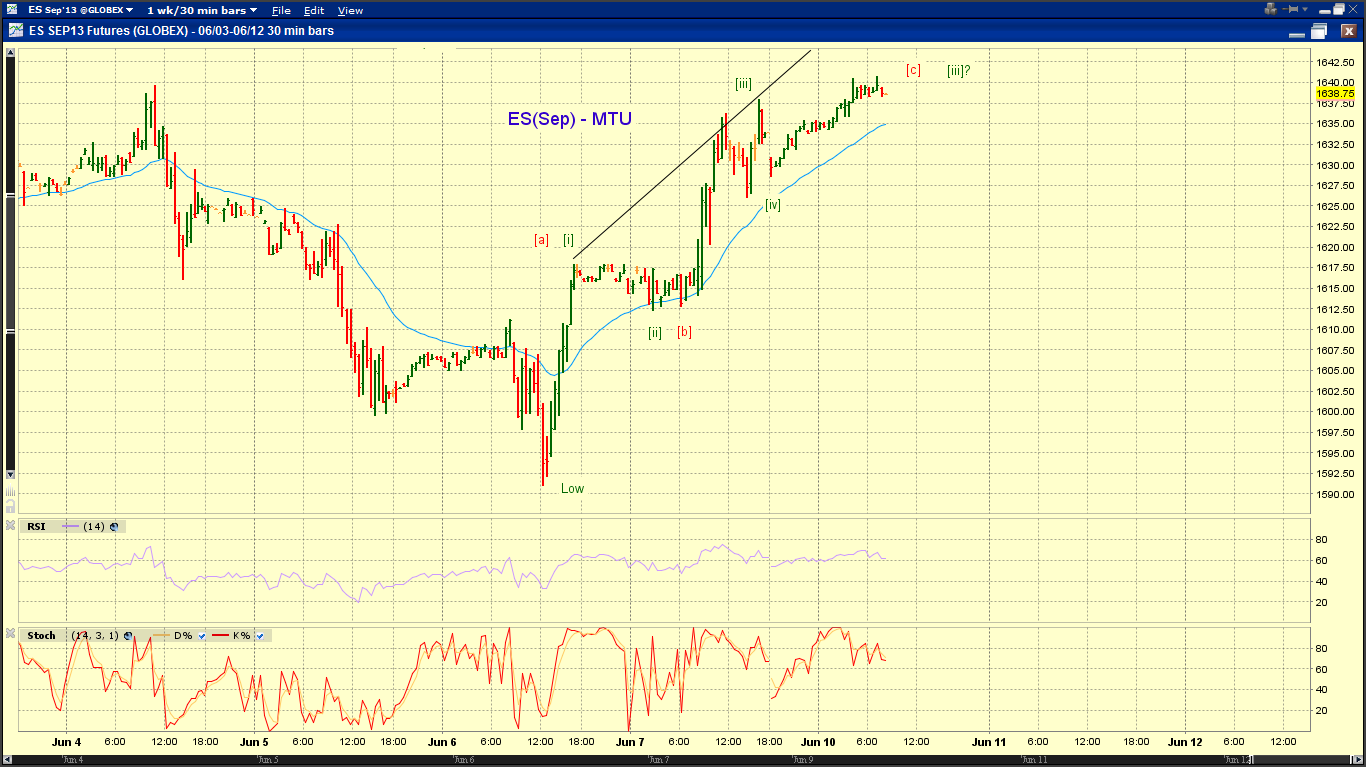
SP500 has likely been building a wave b (or a 2nd wave on the bullish count) off the 1598 low. As chart 1 illustrates,
[green] the proposed wave b could have ended at the close, in a A-B-triangle structure
[blue b1] the proposed wave b is still in progress as an ascending triangle
[blue b2] the proposed wave b is an expanded flat-like structure, with a decline to b2 probable to test the gray trend line.
The red c illustrates the immediately bearish count, where wave c is a triangle instead of wave b.
[8am] ES update -
ES tracking, bullish green and bearish red. See charts. See weekend commentary for analysis.