Wednesday, August 31, 2011

Market Timing Update (8/31/11)

[EOD] Bonds -
A potential triangle in bonds?


[EOD] Stocks -
Please see [310pm] and [346pm] entries for thoughts on SPX - could be working on the blue [v]-up towards the trend channel. Here's a potential expanding EDT in ES.

[346pm] SPX update -
unless this is a 12/12 down set up, the decline appears corrective. see the 2nd chart below. Month End.
[310pm] SPX update -
[11am, 1110am] SPX and ES update -
[740am] ES update -
month end. ES approaching the limit of wave four if it is one (chart 1). The upper trend channel line is attracting price (chart 2).

Tuesday, August 30, 2011

Market Timing Update (8/30/11)

[EOD]Stocks -
Wave structures since the nominal low in SPX and ES. Please see [745am] and [8am] entries below for comments. The upper trend channel line will continue to attract price (see 1245pm entry).
[240pm]SPX update -
squiggles


[1245] ES and SPX update -
Leave room for the market to hit the upper trend channel, back and forth filing notwithstanding. See tracking counts.

[800] SPX update -
regaining previous support.

[745am] ES update -
The bullish count would be a series of 1s2s from the orthodox low (1st chart, green).

The bearish count would be a double zigzag corrective rebound, with a triangle connecting wave (1st chart, black). Regarding the larger picture, the current rebound is rather sizable. Thus it is more reasonable to expect it to be wave (4) from the nominal high under the bearish count (chart 1, red), with lower probability of it being a wave 4 of one smaller degree. If so, leave room for a truncated wave (5)-down, as (5)=(1) from the current rebound high of 1210 projects to 1094.75 in ES.

The super bearish count would be a wave 2-up or wave B-up, approaching its end (not shown)?


Saturday, August 27, 2011

MTU Weekend Ed. - Support and Resistance Matters (8/26/11)

Reading the crash (8/5/11) , Benchmark Low (8/12/11) and Wave Logic (8/19/11) offer analysis and a framework regarding whether the recent crash is the end of a correction or the beginning of further declines. The stock market is in the process of establishing or confirming the proposed benchmark low (Chart 1). There’s little to add to the analysis framework at the moment.

In addition to wave counts, Chart 2 updates the general technical profile.


The rebound in SPX has now retested and closed at three notable trend lines highlighted in Reading the crash (8/5/11) -

(a) the lower channel line off the 2010 low, where the upper channel line connects the April 2010 high to the May 2010 high (blue lines)
(b) the trend line connecting the June 2009 low and June 2010 low (red line)
(d) the lower iso-angle line off the 2009 low, where the upper iso-angle line connects the 2009 low and the 2011 high and the middle line connects the 2009 low and 2010 low (green lines)

A successful break above these trend lines will reclaim key support and a rejection at resistance will spell typical weakness. Note that SPX has already reclaimed potential support from
(c) the 2009 high (green horizontal line)
(e) the 200-week simple moving average (black)

Friday, August 26, 2011

Market Timing Update (8/26/11)

[EOD] Stocks -
[215pm] INDU squiggles -
see 2nd chart below
[1220pm] INDU squiggles -
Squiggle count from today's low, various tracking counts, can be mapped into SPX.
[1105am] on triangle -
If this is a triangle and wave E is in progress, wave D and wave E appear a bit short in duration. It might be prudent to leave room for wave D-down being still in progress and the current rebound as wave [b] of wave D-won.

And then, we have the bullish count. However, the rebound so far is a 1-2-1- need confirmation.

PS - also, NDX made a higher high

[1010am] SPX update, post BB@JH -
[952am] SPX update, pre BB@JH -
see the 2nd chart below.
[8am] ES update -

Thursday, August 25, 2011

Market Timing Update (8/25/11)

[EOD] Stocks -
wave structures since the nominal low in SPX and ES
[10:50am] SPX squiggle update -


[8:30am] ES count update -

Wednesday, August 24, 2011

Market Timing Update (8/24/11)


[315pm and EOD] SPX update -
[1115am] SPX and ES update -
double zigzag retrace or an impulse up
[745am] ES update -

Tuesday, August 23, 2011

Market Timing Update (8/23/11)

[EOD] Stocks and Gold-
SPX Tracking counts - truncated 5th (yet to be confirmed), small-degree w2 rebound, or a lengthy triangle 4th wave.
Gold - December Gold, see chart to the right
[1140am] SPX update -
a potential small-degree five-up, see the 2nd chart below
[1030am] SPX update -
squiggles
[755am] ES update -
potential bullish and bearish triangles (2nd chart)

Monday, August 22, 2011

Market Timing Update (8/22/11)


[EOD] stocks -
Some triangles to consider in addition to the cash index count (255pm).


[255pm] SPX update -
working towards a potentially truncated 5th would be one's guess.
[830am] ES update -

Friday, August 19, 2011

MTU Weekend Ed. - Wave Logic (8/19/11 Close)

Reading the crash (8/5/11) and Benchmark Low (8/12/11) offer analysis and a framework regarding whether the recent crash is the end of a correction or the beginning of further declines.

We wait for the proposed benchmark low. This week’s price action suggests that the benchmark low is around the corner but may not be in place - unless on truncation as Friday's decline (nearly) completed an impulse wave decline from the week's high.

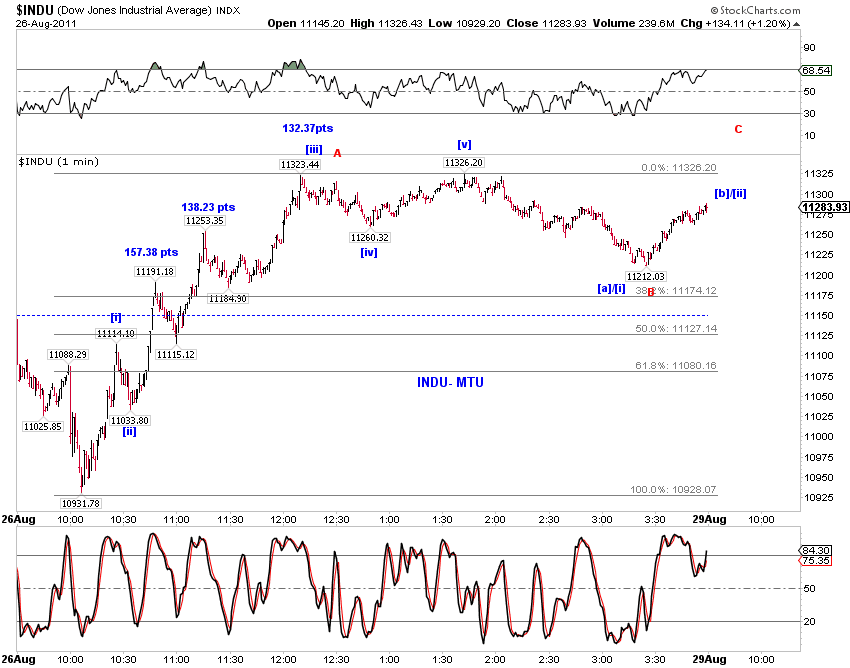
A review of the wave logic should help clarify the big picture at this juncture (Chart 1)

[1] Where’s the top?
There are four candidates for the top (in SPX, INDU and WLSH, etc), i.e. those on Feb 18, May 2, July 7, July 21. The Feb 18th top and July 21st (possibly July 7th) top appear most preferable, since the “only“ palatable ending 5-wave advances are before these two tops.

[2] What’s the local count?
Wave logic then suggests that
(blue labels) the correction could be ending based on the Feb 18th top
(red labels) a new bear trend has just begun based on the July 21st top.

[3] Are bullish counts even possible for NDX and TRAN?
The challenge is obvious - The DJ Transportation Average has already experienced a clear 5-wave decline from its nominal high (Chart 3). The Nasdaq 100 index has also show a steep decline from its nominal high and is about to break its recent low (Chart 2).

However, bullish counts are not yet ruled out - See Chart 2 and Chart 3.

[4] What’s the larger count?
The bullish larger count could be a continued wave x-up from the 2009 low, in the form of a double zigzag or a triple three (Chart 4).

The bearish larger count would be the start of cycle wave c (Chart 5).


Appendix - Technical damage
The recent crash has certainly resulted in significant technical damage. From one perspective, for example, here's an expanding list of world markets that have breached their 2010 low.
Australia, Brazil, France, Germany, Hong Kong, Italy, Japan, Netherlands, Spain, Switzerland, UK (very close), China (approaching), India (approaching).