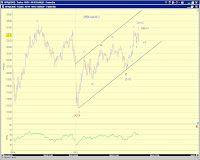
See color coded counts. The most bullish LD wave [1] of v count (blue) is a bit forced as the 3rd wave is the shortest (but not by much). However, it could be a valid, even more bullish, but odd-looking [1][2](1)(2) count, with (3) of [3]-up to follow.

 [4PM Stocks and Yen]
 The primary count is for the market to make one more high - wave v of (c) of [c] of 2 /B - before a potential top. Chart 1 (ES) updates the larger picture wave count.
The Nasdaq composite and the NDX index made a higher high today, while the senior indices and the RUT lagged slightly. This divergence is likely supportive for the senior indices, eventually.
 Regarding the wave structure, either wave iv is still in progress (triangle/flat/combo) or wave v is already in progress. At the moment, odds favor wave iv being still in progress, I think. On the other hand, fifth waves are tricky to navigate as well. Chart 2 (SPX) presents a squiggle count.
I find it worthwhile to repeat the 810AM Real Time Update, but have updated the charts to reflect 4PM levels below.
[810AM] Overnight update (Currencies) -
The intervention of the Yen may have offered a catalyst for a near term trend change - how convenient & too convenient? I'm skeptical that this is the end of the yen strength as It would be a truncated fifth wave from a multi-year perspective. At the moment, the best interpretation is that USD.JPY is at the end of (1)-leading diagonal of [5]. Assuming that a trend change has started, expect a weakening of the Yen to about 110yen/usd or 0.0090usd/yen at the end of wave (2) retrace.
At the same time, AUD.JPY broke out, again become in sync with SPX. Technically speaking, the triangle as outlined by the black trend lines in AUD.JPY does not get invalidated till the June high is violated. But the triangle is looking less appealing now, which would be supportive of SPX if the correlation continues.

