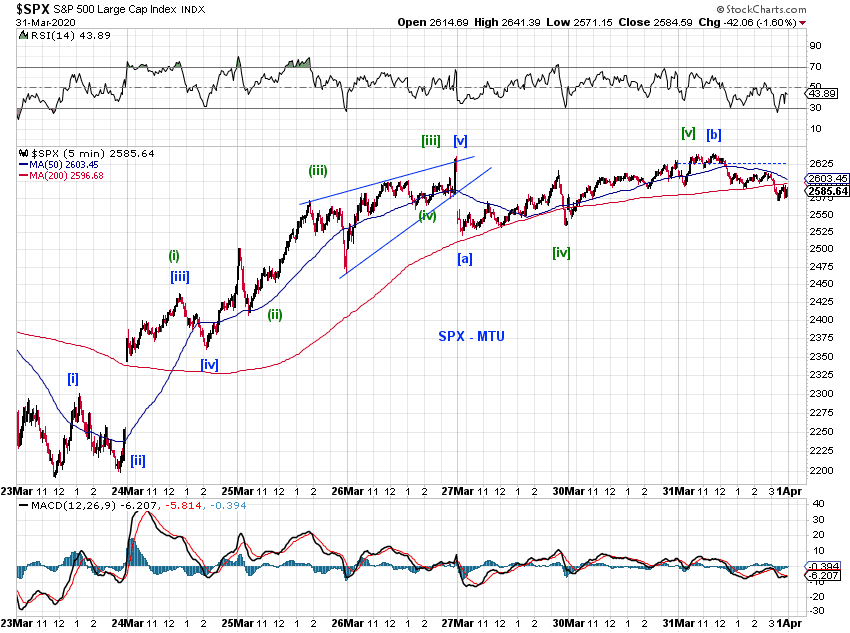
Here we go. Blue wave [4] is at 50% retrace of the last leg down from 3136.72 to 2191.86
Disclaimer: Each post is for informational purposes only. It is not a solicitation, a recommendation or advice to buy or sell any security or investment product. Information provided in each post does not constitute investment advice.
Tuesday, March 31, 2020
Monday, March 30, 2020
Friday, March 27, 2020
MTU Weekend Ed. - Rebound or Bull Trap (3/27/20 close)
We explored longer-term bullish scenarios in Near Term Bottom Fishing (3/20/20). This post explores longer-term bearish scenarios in more detail.
It can be argued that we have a completed five waves up from the 2009 low to the nominal all-time high (Chart 1).
Chart 2 provides a more detailed count on wave [iv]-down of 5-up, as a (w)-(x)-triangle structure often seen in recent years amid market exuberance.
Also note that the plunge in the Dow has already overlapped its wave 3-up (Chart 3), which increases the likelihood that this is a larger degree retrace.
This could be the end of a larger degree wave (5)-up or just 1-up of (5)-up (Chart 4). In either case, a correction of the 11-year run from 2009 to 2020 could be running and is unlikely to have lasted only 6 weeks.
For the near term, we have an impressive bullish weekly candle (Chart 2 above) but SPX is still pressured by the downward trend line until it is broken. For short term tracking, we are monitoring the possibility of a fresh upswing (Chart 5 purple and green) or a fourth wave flat (Chart 5 blue)
It can be argued that we have a completed five waves up from the 2009 low to the nominal all-time high (Chart 1).
Chart 2 provides a more detailed count on wave [iv]-down of 5-up, as a (w)-(x)-triangle structure often seen in recent years amid market exuberance.
Also note that the plunge in the Dow has already overlapped its wave 3-up (Chart 3), which increases the likelihood that this is a larger degree retrace.
This could be the end of a larger degree wave (5)-up or just 1-up of (5)-up (Chart 4). In either case, a correction of the 11-year run from 2009 to 2020 could be running and is unlikely to have lasted only 6 weeks.
For the near term, we have an impressive bullish weekly candle (Chart 2 above) but SPX is still pressured by the downward trend line until it is broken. For short term tracking, we are monitoring the possibility of a fresh upswing (Chart 5 purple and green) or a fourth wave flat (Chart 5 blue)
Thursday, March 26, 2020
Wednesday, March 25, 2020
Wednesday Update (3/25/20)
[EOD Update]-
see intraday update for description
[Intraday Update 1pm NYSE]- More clarity with additional price prints, the low is in (purple (C)) or not (blue [4])
[Intraday Update 1pm NYSE]- More clarity with additional price prints, the low is in (purple (C)) or not (blue [4])
Tuesday, March 24, 2020
Tuesday Update (3/24/20)
[EOD Update]
Chart update to include additional price prints. See intraday update for descriptions.
[Intraday Update, 1:20pm NYSE]
There is more clarity with additional price prints.
Tracking counts
The near term low is in - purple
Bull trap - red and Chart 2 (expanding EDT yet to complete)
Killing time - blue wave [4]-up
Chart update to include additional price prints. See intraday update for descriptions.
[Intraday Update, 1:20pm NYSE]
There is more clarity with additional price prints.
Tracking counts
The near term low is in - purple
Bull trap - red and Chart 2 (expanding EDT yet to complete)
Killing time - blue wave [4]-up
Monday, March 23, 2020
Monday Update (3/23/20)
[EOD Update] -
Tracking counts. A large contracting EDT wave (C)-down has the best visual form so far (Chart 1 purple, Chart 2). The floor is 2016.6 as labeled on the chart.
An expanding EDT wave [5]-down requires another leg lower to exceed 2184.51 (Chart 1 red, Chart 3). The numbers for a contracting EDT wave [5]-down do not work out (missed by about 2 index points at today's low.)
Then there is the possibility of a complex wave [4]-up to take up more time and to alternate with wave [2]-up for the impulse count (Chart 1 blue).
[Intraday Update - 10:30am NYSE] -
Here we go, see previous updates for discussion.
Tracking counts. A large contracting EDT wave (C)-down has the best visual form so far (Chart 1 purple, Chart 2). The floor is 2016.6 as labeled on the chart.
An expanding EDT wave [5]-down requires another leg lower to exceed 2184.51 (Chart 1 red, Chart 3). The numbers for a contracting EDT wave [5]-down do not work out (missed by about 2 index points at today's low.)
Then there is the possibility of a complex wave [4]-up to take up more time and to alternate with wave [2]-up for the impulse count (Chart 1 blue).
[Intraday Update - 10:30am NYSE] -
Here we go, see previous updates for discussion.
Subscribe to:
Posts (Atom)