Tuesday, March 10, 2020

Tuesday Update (3/10/20)


We speculated yesterday that "closing above those lines likely signals a short term bottom."  SPX closed above the blue line on the weekly chart today.  The main tracking counts remain the same. See Chart 1.

But keep an eye on the possibility of an contracting diagonal triangle down, which we discussed yesterday, which requires a wave (E)-down once this potential wave (D)-up is done.  (Chart 2 blue).

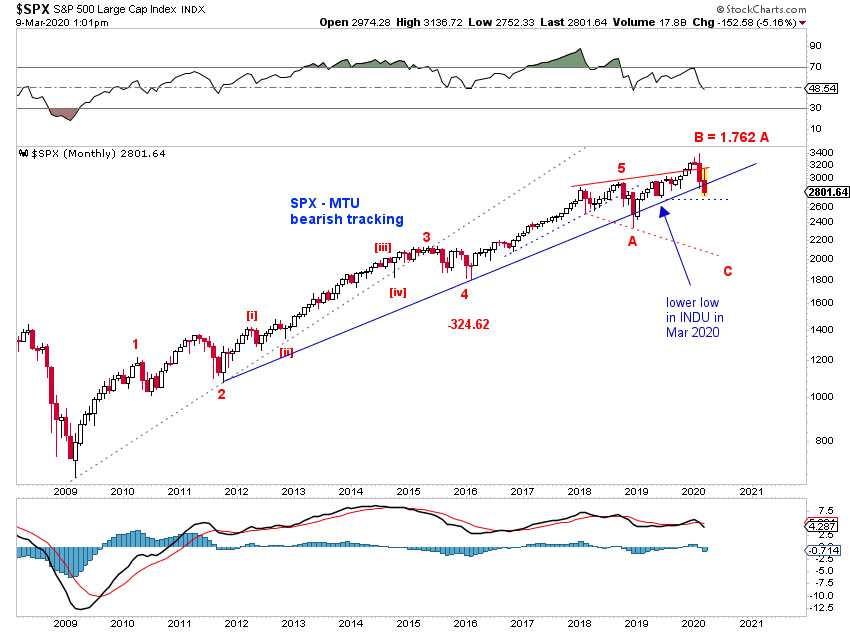
The immediately bearish scenarios would be a small-degree wave 5 down (Chart 2 red), which fits ES/SPX and NDX, but not INDU.


Monday, March 9, 2020

Monday Update (3/9/20)

[EOD Update]
Marginal new low in the afternoon. Chart 1 updates the weekly. The main tracking counts remain as (1)-down of [3]-done or (C)-down of [A]-down (Chart 1),

but keep an eye on a larger diagonal triangle down (Chart 2, blue dotted lines)
   - so far we have 5 days down, 3 days up, 3 days down;  could we have 2-days up then 1-day down to finish a contracting diagonal triangle?

Daily shows positive divergence.


[Intraday Update - 1pm EST]

[2]/(B) likely topped - see yesterday's update on our tracking counts.  Currently (1)-down of [3]-down  or (C)-down of [A]-down .

Keep an eye on the blue line overhead resistance (previous support) in the weekly chart (Chart 1) and the blue 2/4 line overhead resistance (previous support) in the monthly chart (Chart 2).  Closing above those lines likely signals a short term bottom.


Saturday, March 7, 2020

MTU Weekend Ed - Reversal (3/6/20 close)

SPX likely has a reversal which is correcting the exuberant rally since the December 2018 low or possibly beyond.  The February sell-off is already at 51.36% retrace.  Keep an eye on the blue line as potential overhead resistance.  See Chart 1

The rebound since the low managed a to 52.24% retrace of the sell-off (Chart 2).

If the rebound already over, Friday's recovery rally into the close is likely a small degree C wave of a flat (Chart 3 red) - note the higher low in INDU.  Otherwise, the rebound is likely to continue towards the blue line.


Friday, March 6, 2020

Thursday, March 5, 2020

Thursday Update (3/5/20)

[EOD Update]
[Intraday Update - 11am]
Tracking counts update - see chart and previous updates for details

Wednesday, March 4, 2020

Wednesday Update (3/4/20)

[EOD Update] 
By the close today, yesterday's squiggle tracking (updated intraday today) is getting mature (Chart 1).  It's now possible to count the rebound as an impulse wave, which suggests the initial leg of an upswing (Chart 2 green) or final leg of an expanded flat (Chart 2 red).   The blue count in Chart 1 and Chart 2 tracks ABC-rebound where A is a three.

Regarding the large structure, note that SPX is once again back at 50% retrace territory (Chart 2).  Keep an eye on potential overhead resistance as indicated by the blue line on the weekly chart (Chart 3).  Also note the upper BB band on the monthly chart currently is at 3277.53, somewhere in the middle of the unfilled gap.


[Intraday Upate - 1pm EST]
Follow up to the green impulse wave tracking yesterday - now potential thrust out of a small-degree triangle to complete a potential impulse wave (Green).

Tuesday, March 3, 2020

Tuesday Update (3/3/20)

SPX saw a 50% rebound and fills the first overhead gap, but lost its 200SMA after the Fed's emergency rate cut (Chart 1). 
There is now sufficient retrace to conclude the red [2]/[B]-up.  On this count, we have a nice Fibo 5 days down and 3 days up (Chart 2).  However, the rebound to today's high counts better as a triple zigzag than an impulse wave.  See Chart 3 green for the possibility of a thrust higher tomorrow to complete a potential impulse wave.