[EOD] Stocks -
New high on unimpressive price action. Today's high satisfied the minimum requirement of the blue, red and gray counts in Chart 1. See Variations (5/15/15) for discussions. Chart 2 tracks the squiggles in today's advance.
[1120am] SPX update -
Counts, lines, and squiggles. See charts.
[725am] ES update -
ES has been probing the neck line. See chart.
Disclaimer: Each post is for informational purposes only. It is not a solicitation, a recommendation or advice to buy or sell any security or investment product. Information provided in each post does not constitute investment advice.
Monday, May 18, 2015
Saturday, May 16, 2015
MTU Weekend Ed. - Variations (5/15/15 close)
... draft in progress, subject to change ...
SP500 came within 2 index points of making a new record high on Friday and SP500 futures delivered a new all-time high in the pre-market hours. However, momentum and price structures reveal potential underlying weakness. Consider the following potential bull/bear-trap scenarios. See Chart 1.
Here, we track the advance since the October 2014 low (1820.66) as a double three, (a)(b)(c) as [a]-up, followed by [b]-down, then (a)(b)(c) as [c]-up.
[Blue – bull trap] The final wave (c) of [c]-up is in progress. It is an ending diagonal triangle. Expect a short-lived new high, followed by a meaning full sell-off towards the October 2014 low.
[Red – bear trap] The final wave (b)-down of [c]-up in progress, tracing out an expanding triangle or a combination. A minor new high is not required but could briefly surface. Expect a pullback toward the 2067.93 pivot before wave (c) of [c]-up pushes the market to a new high. Under this scenario, we are likely to see a bearish May/June and a bullish June/July.
The green and gray counts in Chart 1 tracks an impulse wave advance off the October 2014 low. Wave 1-up likely ended at the early December 2014 high. Wave 2-down has been quite complex in its structure, with various potential ending points, as highlighted in Chart 1.
Chart 2 offers the big picture.
Friday, May 15, 2015
Market Timing Update (5/15/15)
[810am] ES update -
OPEX. New all time high in ES overnight. Bull-ED overthrow or 3 of 3 up. Bear-A retest of the neckline of a potential IHS or wave C of an expanded flat in ES (potential regular flat in SPX cash). See chart.
Wednesday, May 13, 2015
Market Timing Update (5/13/15)
[EOD] Stocks -
[1140am] SPX update -
Chart 1 - probing the red line once again.
Chart 2 - potential bearish triangle.
Chart 3 - tracking squiggles.
[1140am] SPX update -
Chart 1 - probing the red line once again.
Chart 2 - potential bearish triangle.
Chart 3 - tracking squiggles.
Tuesday, May 12, 2015
Market Timing Update (5/12/15)
[EOD] Stocks -
SP500 filled the most recent upward gap today. The bull-bear tug of war continues. Be aware of a potential bearish triangle as outlined in the charts if upside breakout does not materialize soon. This potential triangle would allow SP500 to probe the downside of the blue EDT trend line. See charts.
[1130am] SPX update -
SPX is probing and struggling with the red/blue support lines in Chart 1. See charts for lines and squiggles.
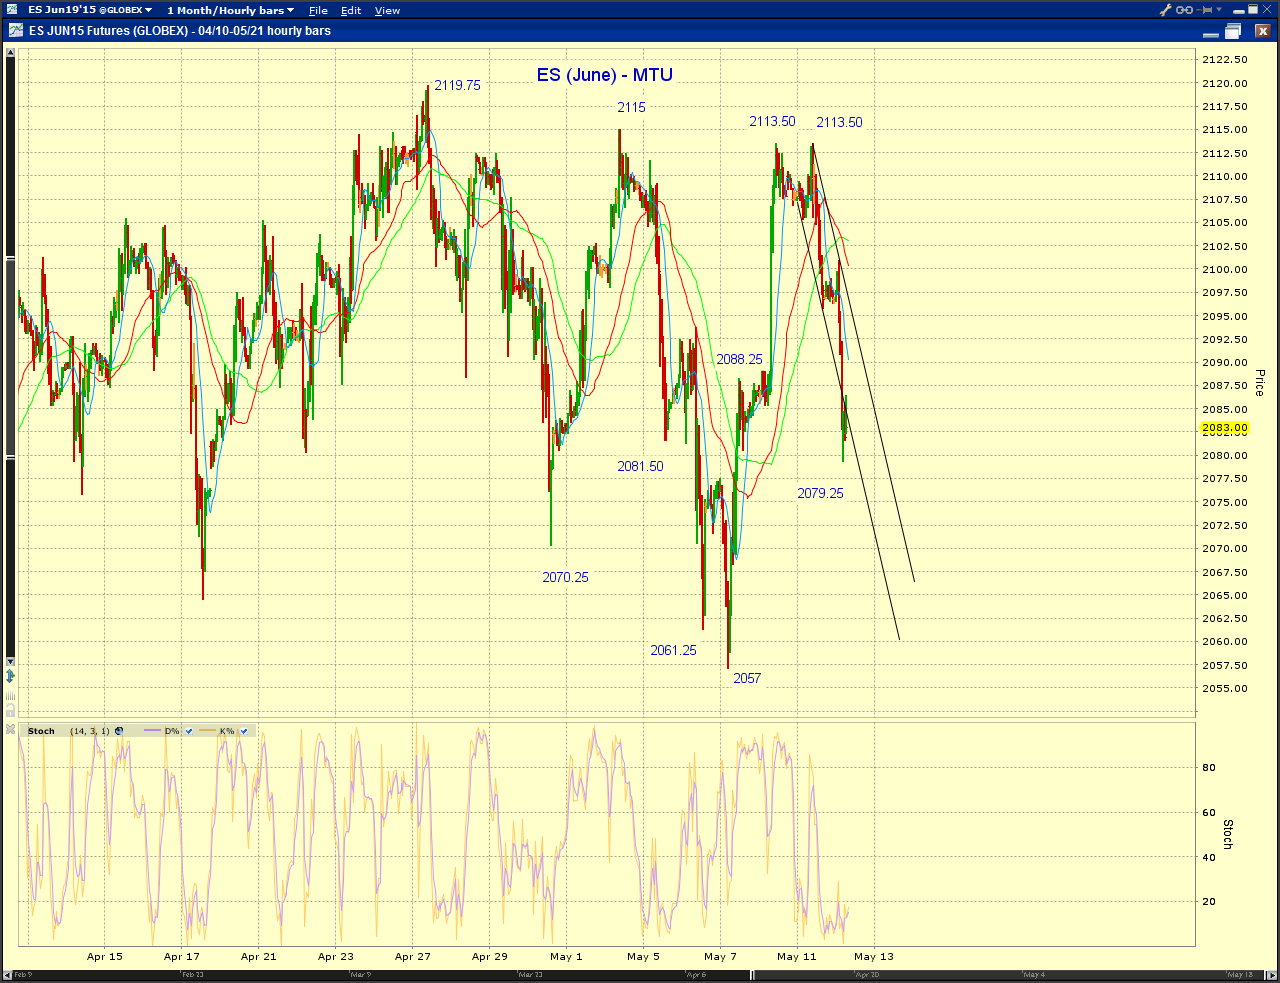
[730am] ES update -
ES is probing the red and black wedge lines on a retrace. If the overnight drop in ES is sustained,the May 8th gap in SP500 should be filled. See charts.
Monday, May 11, 2015
Saturday, May 9, 2015
MTU Weekend Ed. - Short Term Update (5/8/15 close)
... draft in progress, subject to change ...
Recent price actions in SP500 point to the following scenarios (See Chart 1):
[Chart 1 blue] The May low of 2067.93 marks the beginning of the final ABC upswing (as wave [e]-up) of a potential EDT dating back to the October 2014 low. The propose EDT will then conclude Wave [3]-up (or [C]-up) off the 2009 bottom (Chart 2 blue).
However, ambiguities in short term wave structures and the sharpness of the recent rebound may require SP500 to make a new all-time high to make it convincing.
On the bullish side,while SP500 has yet to regain its May high (of 2120.95), its A/D line has slightly exceeded its counterpart (Chart 3). The month of May continues to look bullish based on the Decennial Cycle (Chart 4).
On the bearish side, The Presidential Cycle suggests potential weakness for the Month of May, especially over the next two weeks (Chart 5). Moreover, the EDT mentioned above may have already been complete at the its all-time high of 2125.92 (Chart 1 red).
On the super bullish side, if the rally in SP500 is sustained and picks up momentum, a nascent wave [iii] of 3 surge may be in progress (Chart 1 green) . In this scenario, SP500 finally breaks out of its multi-month consolidation range and be well on its way to complete wave [5] off the 2009 bottom (Chart 2 green).
Recent price actions in SP500 point to the following scenarios (See Chart 1):
[Chart 1 blue] The May low of 2067.93 marks the beginning of the final ABC upswing (as wave [e]-up) of a potential EDT dating back to the October 2014 low. The propose EDT will then conclude Wave [3]-up (or [C]-up) off the 2009 bottom (Chart 2 blue).
However, ambiguities in short term wave structures and the sharpness of the recent rebound may require SP500 to make a new all-time high to make it convincing.
On the bullish side,while SP500 has yet to regain its May high (of 2120.95), its A/D line has slightly exceeded its counterpart (Chart 3). The month of May continues to look bullish based on the Decennial Cycle (Chart 4).
On the bearish side, The Presidential Cycle suggests potential weakness for the Month of May, especially over the next two weeks (Chart 5). Moreover, the EDT mentioned above may have already been complete at the its all-time high of 2125.92 (Chart 1 red).On the super bullish side, if the rally in SP500 is sustained and picks up momentum, a nascent wave [iii] of 3 surge may be in progress (Chart 1 green) . In this scenario, SP500 finally breaks out of its multi-month consolidation range and be well on its way to complete wave [5] off the 2009 bottom (Chart 2 green).
Subscribe to:
Posts (Atom)