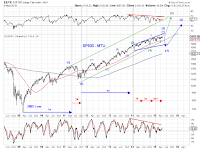
Recent price actions in SP500 point to the following scenarios (See Chart 1):
[Chart 1 blue] The May low of 2067.93 marks the beginning of the final ABC upswing (as wave [e]-up) of a potential EDT dating back to the October 2014 low. The propose EDT will then conclude Wave [3]-up (or [C]-up) off the 2009 bottom (Chart 2 blue).
However, ambiguities in short term wave structures and the sharpness of the recent rebound may require SP500 to make a new all-time high to make it convincing.
On the bullish side,while SP500 has yet to regain its May high (of 2120.95), its A/D line has slightly exceeded its counterpart (Chart 3). The month of May continues to look bullish based on the Decennial Cycle (Chart 4).
 On the bearish side, The Presidential Cycle suggests potential weakness for the Month of May, especially over the next two weeks (Chart 5). Moreover, the EDT mentioned above may have already been complete at the its all-time high of 2125.92 (Chart 1 red).
On the super bullish side, if the rally in SP500 is sustained and picks up momentum, a nascent wave [iii] of 3 surge may be in progress (Chart 1 green) . In this scenario, SP500 finally breaks out of its multi-month consolidation range and be well on its way to complete wave [5] off the 2009 bottom (Chart 2 green).


