http://en.wikipedia.org/wiki/Chicka_Chicka_Boom_Boomhttp://www.youtube.com/watch?v=4QdN-HYp46cnew development [1]
[1] U.S. stocks have been recovering for a 3rd consecutive week.
[2] Major benchmark indexes closed solidly above their 2010 high (
Chart 1). On a closing bases, SP500 was up 2.12%, 5.98% and 1.12% for the first, second and third week of October.
[3] Stocks have once again arrived at a point with notable near term divergence. Such divergence often occurs at turning points and (complex) consolidation areas.
Wilshire 5000, SP500, the Dow and Dow transports broke above the August-September congestion range. However, midcap and smallcap indexes did not offer confirmation, nor did the Global Dow and key European benchmarks. (While the London FTSE has risen above its August and September highs, it did not manage a higher high during Friday’s session as did several U.S. indexes.)
In particular, we note the relative strength in the Dow and the relative weakness in the Nasdaq 100 index. For the Dow, a potential inverse head-and-shoulder pattern points to about 350 index points of upside potential from the breakout point (to around 12050) if the pattern succeeds (
Chart 2). On the other hand, NDX (via its futures NQ) has been seriously lagging (
Chart 3).

 An expanded flat rebound less likely - Clues from Nasdaq and TransportsBottom line - With the assumption that the October rebound is relatively in sync between Nasdaq 100 index (NDX) and SP500(SPX), and relying on the relatively more obvious wave structure in Transports (TRAN), one finds that odds favor a zigzag rebound or the bottom being in place. While it is not prudent to completely rule out an expanded flat rebound since the above conclusion relies on the assumptions that key benchmark indexes are relatively in sync, it is reasonable to lower its likelihood.
To illustrate,
Chart 4 refreshes various tracking counts on SPX discussed in recent weekly commentaries. At this juncture, it is extremely useful if one can correctly assess the (relative) odds of whether the October rebound is (a) wave C of an expanded flat (
blue,grey,red), (b) the start of a zigzag rebound (
purple), or (c) the start of a bullish trend (
green).
Assumption - key benchmark indexes are relatively in sync.
Evidence 1 - The Nasdaq 100 index futures (NQ) shows a clean five wave advance that ended on October 17th (cash index high on October 14th). See
Chart 3 above. Thus, the October 14th/17th high is likely the end of the first wave up from the low.
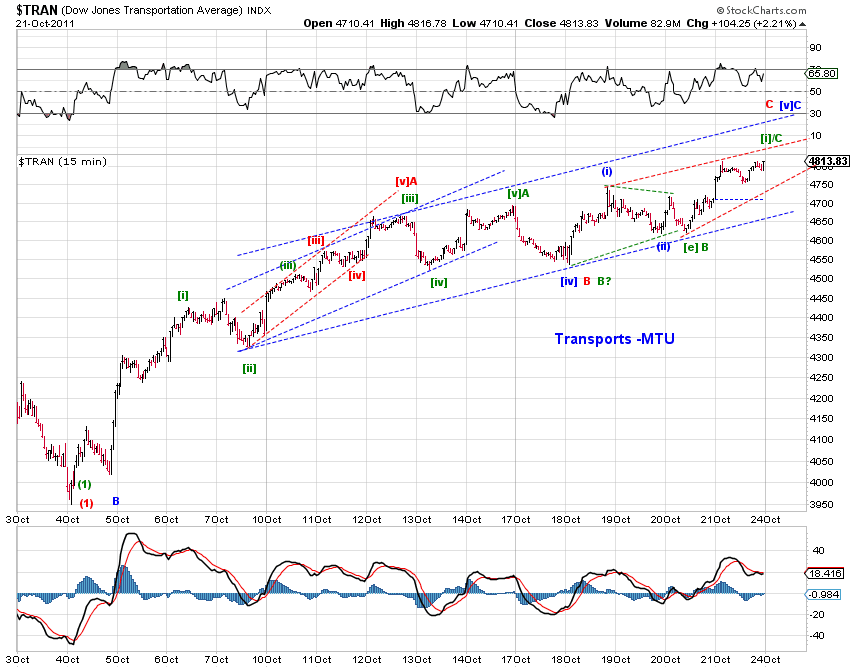
Evidence 2 - As transports had led the market during the crash by avoiding truncations and by first breaking below the August-September consolidation zone, it has also led the rebound. Its wave structure is relatively more obvious (
Chart 5).
Conclusion -
[1] An expanded flat rebound is less likely.
Combining the assumption and two pieces of evidence, odds favor a zigzag rebound or the bottom being in place. The
green count in Chart 5 is the preferred count. The corresponding count on SPX is the
green count in Chart 6.
In the case that the bottom is in, one only needs to replace A/B/C with 1/2/3. See
Retrace or Breakout (10/14/11) for how this structure fits into the larger cycle wave b-up.
[2] You are (potentially) here.
Therefore, the market is approaching the end of [i] of C (with a small chance of it being C itself) or end of [iii] of C (if B was very short and possibly C is a potential EDT). One can track the evolving wave C/3 and apply the standard fib relationship between A/C (1/3) to pin down the next high.


 Chart 3 and Chart 4 present the tracking count on NQ, which so far has failed to make a higher high beyond the October 17th high. The decline is also a three so far.
 [215pm] NDX/NQ update -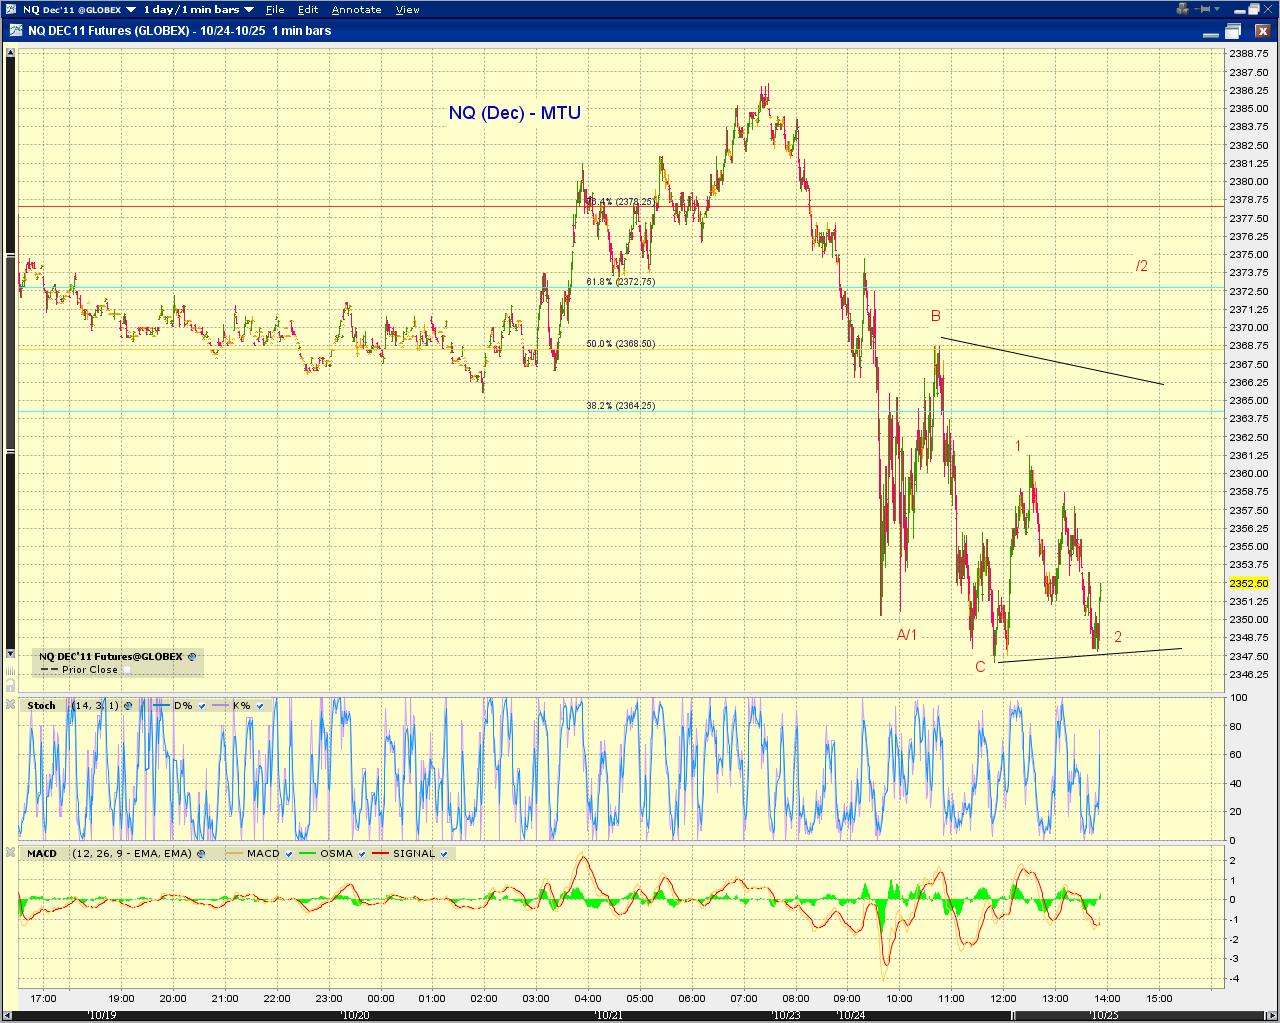


 [840am] ES, NQ update -
 [740am] DAX update -