Tuesday, March 22, 2011

Market Timing Update (3/22/11)

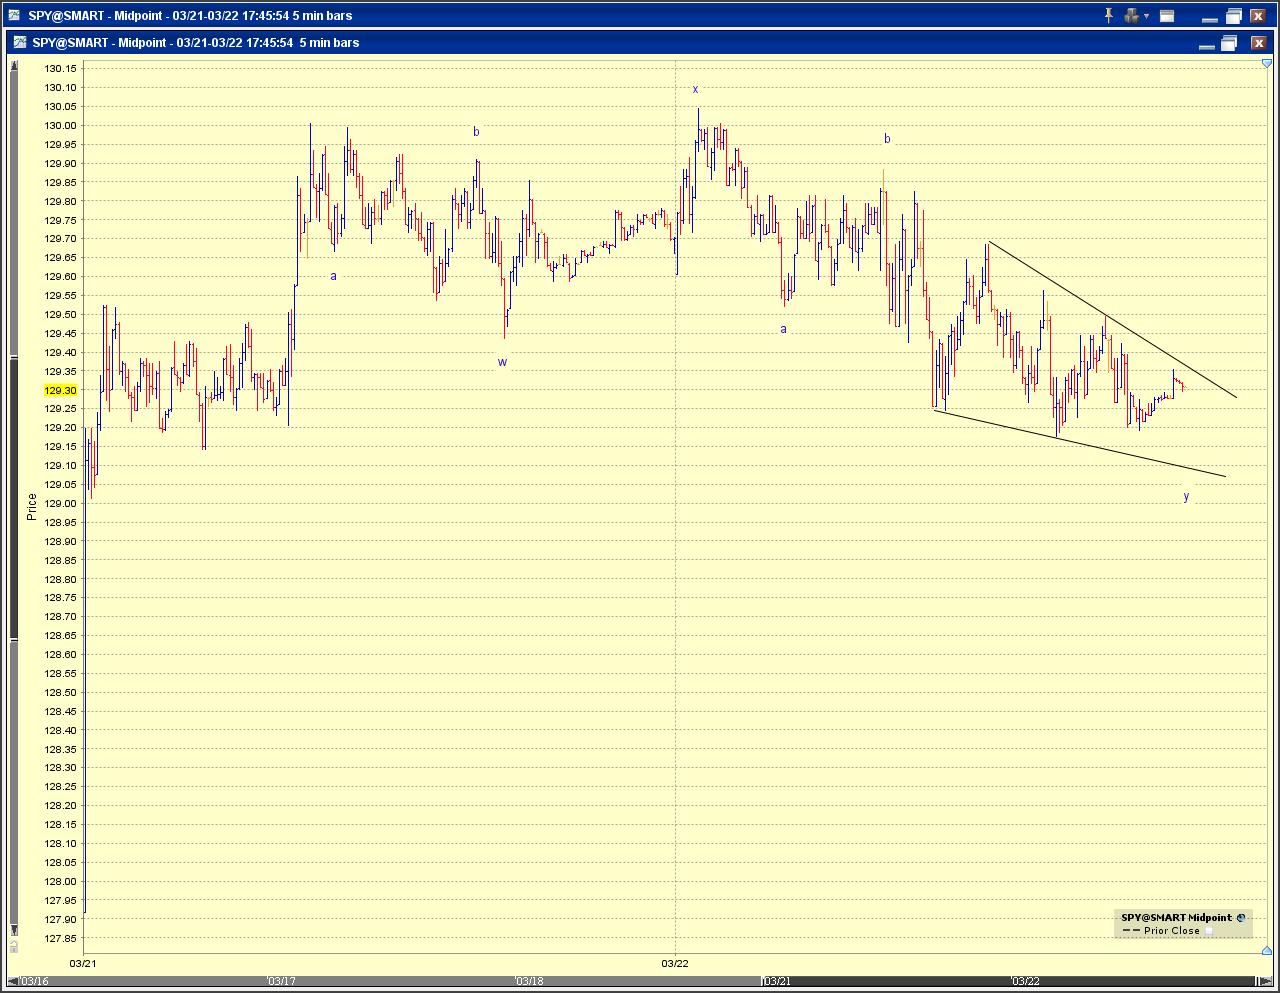
[545pm] SPY squiggles -
And the squiggles in SPY, including those in after-hours, are informative regarding the potential structure of the current pullback.


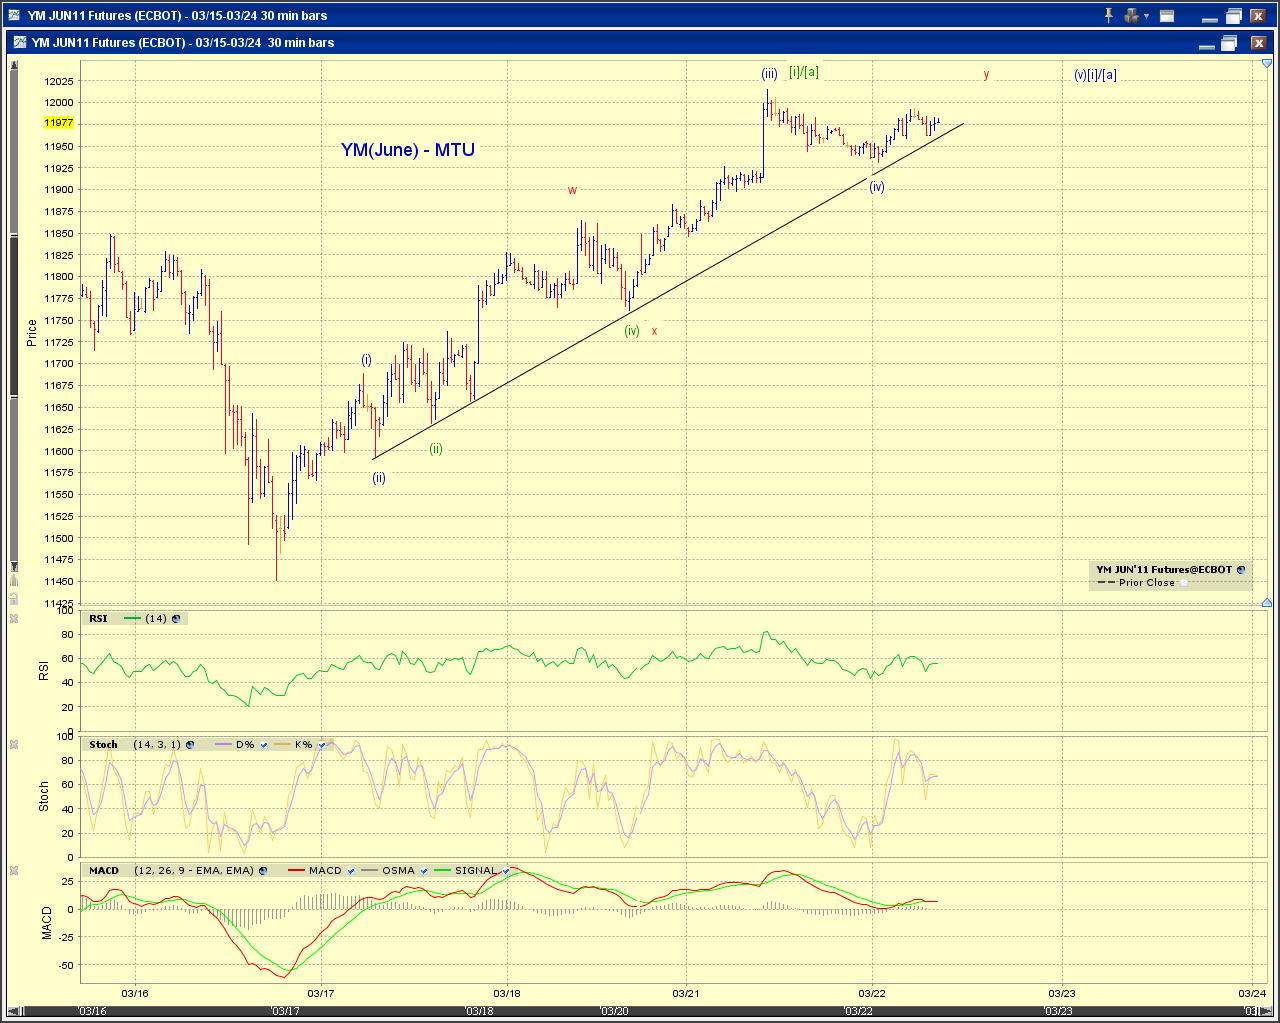
[EOD] Stocks -
The Dow futures give the "clearest" view of the wave structure. The 3rd chart updates the squiggle count on SP500 cash. Squiggles raise the potential for larger pullback.
[1pm] Squiggles (SPX)-


[810am] Overnight update -

Sunday, March 20, 2011

Market Timing Update (3/21/11)

[EOD] stocks -
No change regarding the count update highlighted in the 1140am entry.

SPX closed below is MA50, but INDU which has been the leader so far closed above its MA50.

Across indexes, RUT and TRAN appear to be most bullish.

[1140am]Count update (SPX) -
"Odds favor perhaps the most bullish and the most bearish bearish counts ..."
[9am]Overnight update (USD) -
DX declined to 75.50 overnight. DX has been wedging. A potential tracking count:


[820am]Overnight update (stocks) -
see squiggles on YM below
[3/20/11 Saudi TASI]

Friday, March 18, 2011

MTU Weekend Ed. - Path of least resistance / support (3/18/11 Close)

Overview
Stock market broke prior week's support and probed meaningfully lower with force. A down-up-down sequence from the February high completed this week, and has been followed by a respectable rebound into Friday's close.

There's substantial amount of ambiguities regarding whether the sell-off is a correction or a trend changer (see below). The path of least resistance (or more appropriately, the path of least support) is now down.

A violation of the current low suggests at best a larger correction and at worst the end of the hope rally. The personality of the decline should be informative.

Bearish counts will continue to linger even if the market continues to rebound - recall the April-August episode last year?

Scenarios
Odds favor perhaps the most bullish and the most bearish bearish counts (Chart 1) based on the bullish and bearish elements outlined below.

Bullish counts - The correction is over, tracing out an ABC structure. Two variants of this count are a larger correction with the current rebound being wave [x] of a double three or a sideways triangle with the current rebound being wave [b] (Chart 1, blue).

Bearish counts - The market is tracing out a series of 1s and 2s, with the current rebound being (ii)-up of [iii]-down (Chart 1, red). A variant of this count is that the current rebound is wave [iv] of 1-down to complete an initial 5-wave decline (Chart 1, purple).

Observations
Bullish elements
On a daily basis, the second down leg is accompanied by improving breadth (Chart 2). It should be noted, however, intraday selling has been quite intense over the past week.
The market found support, for now, at [1] the trend channel since the July low, [2] the trend line since the March 2009 low, and [3] the 50-week moving average (Chart 3).
Mid-caps, small-caps and transports have been much more resilient than large-caps.

Bearish elements
The second down leg moved beyond equality with respect to the first down leg.
The second down leg moved beyond the base channel.
The market is now below its 50-day moving average and the deterioration in the technicals on the weekly chart is notable (Chart 3).
Bearish event risks.

Nasdaq 100
NDX has been one of the hardest hit indexes so far. But it also has the clearest positive divergence on the 60-minute chart (Chart 4). Chart 5 offers a bullish squiggle count of the rebound.

Appendix - futures
Bullish, semi-bullish and semi-bearish, bearish counts.
Squiggles from the low

Market Timing Update (3/18/11)

[120pm] Squiggle update (YM) -
YM (as well as INDU) showing the cleanest 1-2-3 or A-B-C count so far.


[825am, 928am] Overnight update (Oil) -
Before and after cease fire
[820am] Overnight update (Stocks) -

Thursday, March 17, 2011

Market Timing Update (3/17/11)

[EOD]stocks -
For the larger count of the sell-off, please see the [1pm update] below. The following chart counts the squiggles from the low.

[1pm]Count update (NQ, ES) -

To follow the clearer structure in NDX.
[Overnight update] -

Wednesday, March 16, 2011

Market Timing Update (3/16/11)

[1000pm]Futures - no change, so far as high as 17.25 points higher than the low to date.
[615pm]Futures -
Another tracking count assuming the bottom does not fall out from here. This one tracks well in ES, YM, and NQ. At the moment, [c]=1.335x[a] which is more acceptable in a corrective structure.


[EOD]stocks -
The thoughts and observations presented in yesterday's EOD update remain applicable. Chart 1 to the right updates the larger structure using March ES contract.

The new development today is that a lower low was registered in many indexes with the exception of RUT, TRAN and MID. This creates interesting features in wave counts and interesting divergence among indexes.


Chart 2 (SPX) and Chart 3 (INDU) show various tracking counts on the cash indexes - the uncertainty lies with where did wave [b]-up or wave [ii]-up ended - that have the low being in today or have at least one more subdivision down. Chart 4 shows the similar situation that ES faces.

The path of least resistance ?
[1250pm]ES update -
[Overnight update] -

Tuesday, March 15, 2011

Market Timing Update (3/15/11)

[746pm] ES update
Update on the ES squiggles posted below.


[EOD] Observations
[1] If the current decline is a minor (or now much less probable minute) degree A-B-C correction, the low should be in.

As the March ES chart in the overnight update below shows, C = 1.57 A.
In cash SPX (Chart 1), C=1.429 A.

Any "meaningful" probe below the over night low would strongly suggest at least a correction at a larger degree (e.g., with respect to the July low as (X)of [Y], with respect to the 2009 bottom as [B] of x) if not the outright top of the hope rally (P[2] or x)

[2] Squiggles remain ambiguous in both cash and futures and are yet to deliver a complete five-up (Chart 2 and Chart 3).


[3]
The bearish counts will likely survive for some time even as the market continues to rebound higher - recall the 2010-April-to-August experience. Chart 4 tracks the proposed corrective and impulsive counts.


[Overnight update]