
Tuesday, January 22, 2019
Tuesday Update (1/22/19)
Either the blue 5 failed or the red C or green 5 (with a triangle green 4) completed at the rebound high. See the weekend update for more details.


Friday, January 18, 2019
MTU Weekend Ed.- Rebounding III (1/18/19)
SPX closed above its 50-day SMA and has ventured into the prior congestion zone (Chart 1). It likely is finishing an impulse wave, tracked as A-up or 1-up or D-up (of an expanding diagonal), from its December low (Chart 2 blue or green). Depending on where wave four ends, the current leg of rebound could be ending or has a small-degree wave four-down and wave five-up left (Chart 3 SPX and Chart 4 ES). If the first leg up from the December low is a zigzag, it's possible to track this rebound as wave (X)-up in its entirety (Chart 2 red).


Thursday, January 17, 2019

Wednesday, January 16, 2019
Wednesday Update (1/16/19)
It probably takes a gap down and go to confirm the red "terminal" count. Otherwise, a small-degree [v]-up looks likely.


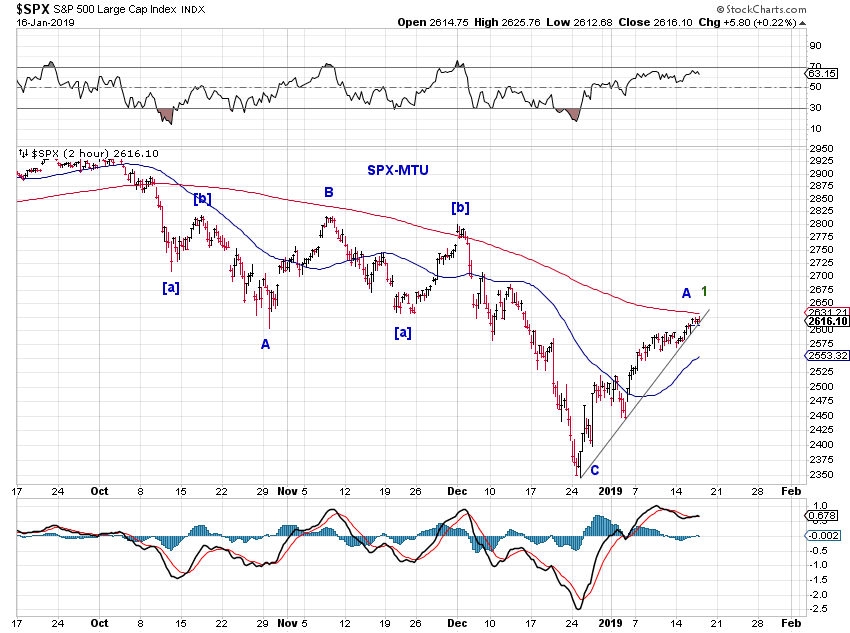
Tuesday, January 15, 2019


Monday, January 14, 2019
Monday Update (1/14/19)
SPX is poised to roll over. A lower low is necessary to eliminate the potential fourth wave triangle, particularly in ES.


Sunday, January 13, 2019
MTU Weekend Ed. - Rebounding II (1/11/19 close)
The first two charts update the bullish and bearish tracking counts. For the bearish tracking, given the size of the rebound, the current rebound is much more likely to be wave D-up of a diagonal triangle/ triple three (Chart 2) than a fourth wave (not shown).
Chart 3 tracks the squiggles of the current rebound.


Chart 3 tracks the squiggles of the current rebound.


Subscribe to:
Posts (Atom)