Monday, June 10, 2013

Market Timing Update (6/10/13)

[EOD] Stocks update -
SP500 has likely been building a wave b (or a 2nd wave on the bullish count) off the 1598 low. As chart 1 illustrates,
[green] the proposed wave b could have ended at the close, in a A-B-triangle structure
[blue b1] the proposed wave b is still in progress as an ascending triangle
[blue b2] the proposed wave b is an expanded flat-like structure, with a decline to b2 probable to test the gray trend line.

The red c illustrates the immediately bearish count, where wave c is a triangle instead of wave b.

[8am] ES update -
ES tracking, bullish green and bearish red. See charts. See weekend commentary for analysis.


Friday, June 7, 2013

MTU Weekend Ed. - Tracking Update (6/7/13)

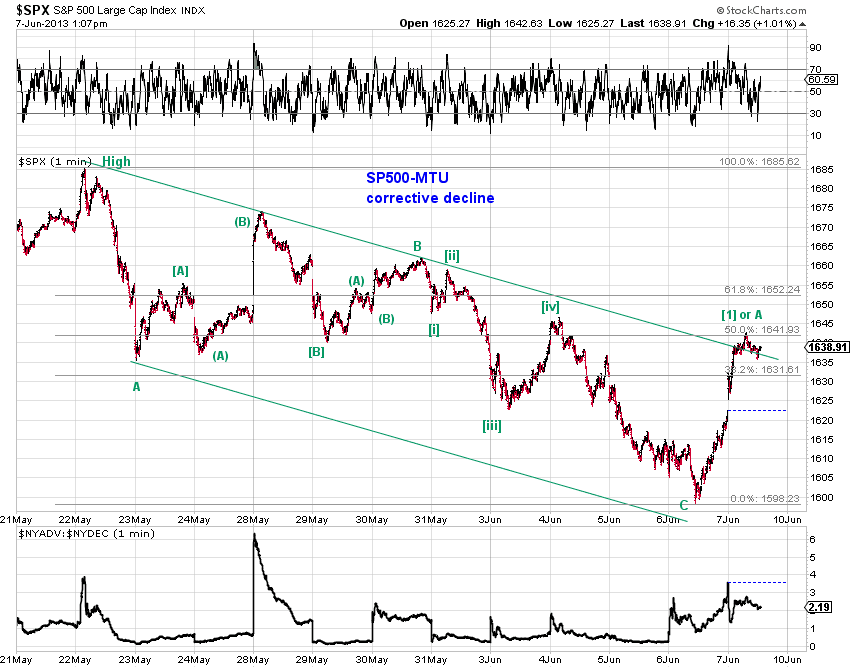
SP500 fell 5.27% from its all-time high to Thursday’s low in a likely three-wave structure before rebounding off its 50-day moving average (Chart 1). From a bearish perspective, as discussed in Monthly Outlook Update (5/31/13) and Bull or Bear (5/24/13), we associate three tracking counts with the recent sell-off (Chart 1):

[blue] The recent sell-off is part of wave (4)-down of [C]-up. Thursday’s low is likely A of (4) and Friday’s rally is B of (4). Wave (4) will either see further declines towards 1550 or a sideways consolidation to consume time (e.g. triangle).  The subsequent wave (5) up likely offers some meaningful upside potential.

(Subjective) probability - Given the magnitude of the sell-off - note that Thursday’s low came within an index point of the April high in SP500 and overlapped the April high in the Dow - this count appears the most likely at the moment.  Under this interpretation, wave (4) could have ended at Thursday's low, a probable but relatively less likely scenario at the moment.   

[green (arrow)] The recent sell-off is wave (iv)-down of 5-up of (5)[C]-up. Wave (iv) ended at Thursday’s low and wave (v)-up of 5(5)[C]-up is in progress. In this case, wave (v) will reach equality with wave (i) at 1702.88 which is less than 1% above the May high of 1687.18 (Chart 2). As such, only a minor new high is likely and soon to be followed by a more meaningful sell-off.

(Subjective) probability - While the count is viable, the magnitude of the sell-off is undesirably large for the proposed wave (iv) as noted above. Thursday’s low needs to hold and net upside potential is limited at 1% beyond the May high.

[red] The Hope Rally has topped in May. The initial sell-off is likely a series of first and second waves (Chart 3, blue).

(Subjective) probability - Support at Thursday’s low needs to fail first and the nature of the accompanying sell-off needs to favor a third wave (rather than wave C of (4)). Neither condition  is at hand at the moment, although risk-reward is quite attractive for bearish exposure if this count plays out.

Finally, we present the bull market tracking of the Hope Rally with the latest price data in Chart 4.  See Bull or Bear  (5/24/13) for discussions.
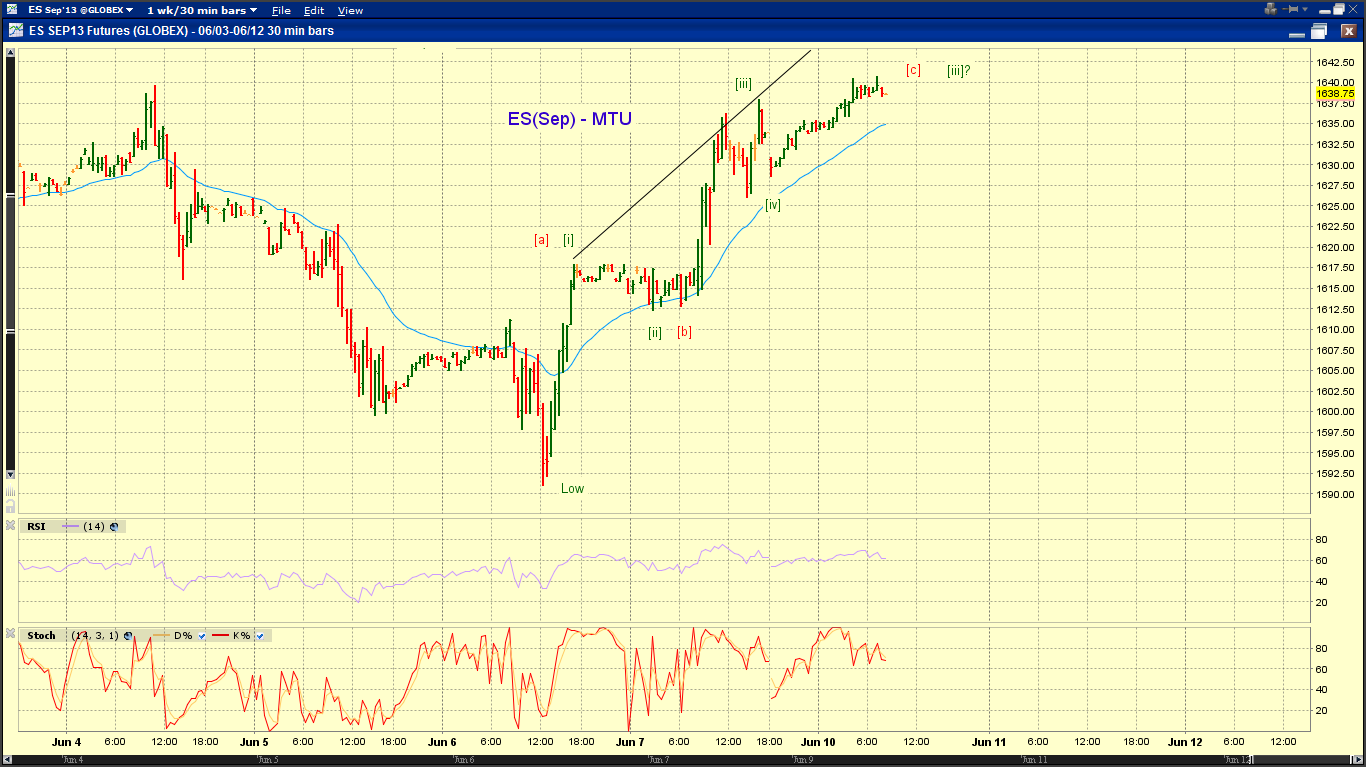


Market Timing Update (6/7/13)

[110pm] SPX update -
Update on an impulsive or corrective decline from the nominal high in SPX. See charts.
With the strong rebound from yesterday's low, the bearish impulsive decline now favors an LD-1 down or [i]/[ii]/(i) decline. From this perspective, the current rally is 2-up or (ii)-up.


[8am] SPX and ES update -
Chart 1 and Chart 2 tracks an impulsive or corrective decline from the nominal high in SPX as of yesterday's close.

Chart 3 presents tracking counts on ES in real time. In ES, we are looking at
(blue) a completed flat or (green) a completed zigzag or
(red) a impulse anticipating [v]-down of 3-down


Thursday, June 6, 2013

Market Timing Update (6/6/13)

[945am] SPX update -
corrective and impulsive tracking. see charts.


[8am] ES update -
Note the bullish EDT (green) and the bearish LDT (red-alt, blue-alt) potential in Chart 2, both suggesting potential for a near term rebound.  Bearish tracking counts are red and black.


Wednesday, June 5, 2013

Market Timing Update (6/5/13)

[EOD] Stocks -
Chart 1 tracks top counts with the assumption of an impulse wave decline from the all-time high in SPX. Chart 2 tracks with the assumption of a corrective pullback.

Impulse wave decline (Chart 1)
[blue] SPX is approaching the end of (iii) of [iii] down.
[red] SPX is approaching the end of an LD wave 1 down.

Corrective pullback (Chart 2)
[red] A triple three structure is approaching its end
[green] A zigzag structure is approaching its end.
[blue] A larger combo. A upward expanded flat connecting wave (B) is in progress.


[1055am] SPX update -
SPX continues to track a triple three / LD-down or a expanded flat (B) as discussed yesterday. See charts.


[8am] ES update -
Note the red 1/2/3 (or ABC) count with a small-degree 4th wave triangle and the blue triple three count.


Tuesday, June 4, 2013

Market Timing Update (6/4/13)

[EOD] Stocks -
The Dow made a lower low today while the recent low in SP500 held. Favor
[1] the blue count of a flat (B) up in Chart 1, part of blue(4)-down in Chart 2.

or [2] the red count of one more leg down to finish a triple three, part of green (iv)-down in this chart, or the bearish LD decline.

The bullish alternative has the low in place at today's low, as the green (iv) in this chart


[125pm] SPX update -
[946am] counts continue to tracking. Updated squiggles from all-time high and recent low. See charts.


[946am] SPX update -
Matching SPX squiggles. See charts.


[930am] ES update -
If the low is not in at the green C, note the potential blue triple three or a large LD-down structure. The potential for a series of 1s2s in ES are indicated by the red count. See chart.


Monday, June 3, 2013

Market Timing Update (6/3/13)

[EOD] Stocks -
The blue count in Chart 1 shows a completed zigzag decline from the May high in SPX. The zigzag took the form of A-triangle B-C and is thus corrective. Alternatively, the rally into the close could be a small degree wave iv as the red count in Chart 1 suggests. However, the market needs to sell-off overnight in order to avoid i/iv overlap.

According to our tracking counts, if a near term low is in place, it would be the green wave (iv) in Chart 2. The subsequent advance would wrap up the black wave 5 or green wave [iii] in Chart 2.

Bearish counts would be a series of 1s2s or a larger degree wave (4) pullback.

Please see Monthly Outlook Update (5/31/13) for additional analysis.


[1217pm] SPX/ES update -


[820am] ES update -
The first trading day of June. Please see weekend post for discussion.