Wednesday, May 16, 2012

Market Timing Update (5/16/12)

[EOD] Stocks -
We have another lower low in many indexes today. However, today's down leg offered us the fifth wave of an EDT (bullish) or LDT (bearish).  See Chart 1.

The overnight low in ES touched the first EWP support for a wave 4 (i.e. the lower boundary of the acceleration channel), see Chart 2. The overnight low in ES is still holding but with a thin cushion.


[125 pm] SPX squiggles -
See 2nd chart below.
[825 am] ES update -


Tuesday, May 15, 2012

Market Timing Update (5/15/12)

[EOD] Stocks -
US stocks are likely approaching an emotional low. As shown in Chart 1, the proposed low is [y]-down of a two-month pullback or C down from the recent high based on the bullish interpretation, and [i]-down of a nested 1/2/[i]/[ii] setup based on the bearish interpretation. SPX has also declined into prior support/resistance zone. Chart 2 shows wave structures across major benchmarks based on the bullish interpretation.

[1145am] SPX/ES update -
This mornings low in ES is holding so far, while the low in SPX cash got breached before the current rebound. See updated primary count for SPX and squiggle on ES.


[9am] ES update -
Potential EDT in ES if the low is not in. See yesterday's EOD update for details.


Monday, May 14, 2012

Market Timing Update (5/14/12)

[EOD] Stocks -
From a bullish perspective, the bottoming process has likely (almost) run its course (Chart 1). There's potential for a truncated low in cash index although one more lower low to finish (c)-down of [y]-down would be normal.
The blue count in Chart 2 is the preferred count under this interpretation. The green count is more near term bullish and the purple and red counts are more bearish ones.
Please also see DAX and SP500 (5/11/12) for thoughts on the bigger picture.


[1255pm] SPX squiggles -


[9am] ES update -
ES appears to be thrusting down from a triangle to complete a five-down or ABC down. See the 2nd chart for the larger structure.


Friday, May 11, 2012

MTU Weekend Ed. - DAX and SP500 (5/11/12 close)

DAX
The European sovereign debt crisis is back in focus in recent days. Since SP500 and DAX have been tracking each other well, taking another look at the German DAX can shed light on U.S. stocks. For example, the correlation between SP500 and DAX is obvious as shown in Chart 1.


Whether the sell-off over the past two months is an wave X pullback (Chart 1, blue) or a bearish trend change (Chart 1, red) in DAX requires further confirmation. However, the price pattern (wave structure) in DAX from its March high is reasonably well formed.

More interestingly, the long term price pattern of DAX is telling. From its Y2K high, DAX appears to be in a generational triangle consolidation (Chart 2).

If the 2009 low holds, one of several ascending triangles is likely at play (Chart 2, blue, dashed blue, green). The end of the proposed triangle (i.e. wave e) is likely to coincide with the worst market sentiment regarding the European sovereign debt crisis.

If the 2009 low fails, key possibilities are a larger triangle (Chart 2 gray), a flat (Chart 2 purple) or a much more bearish development (Chart 2 red).


SP500
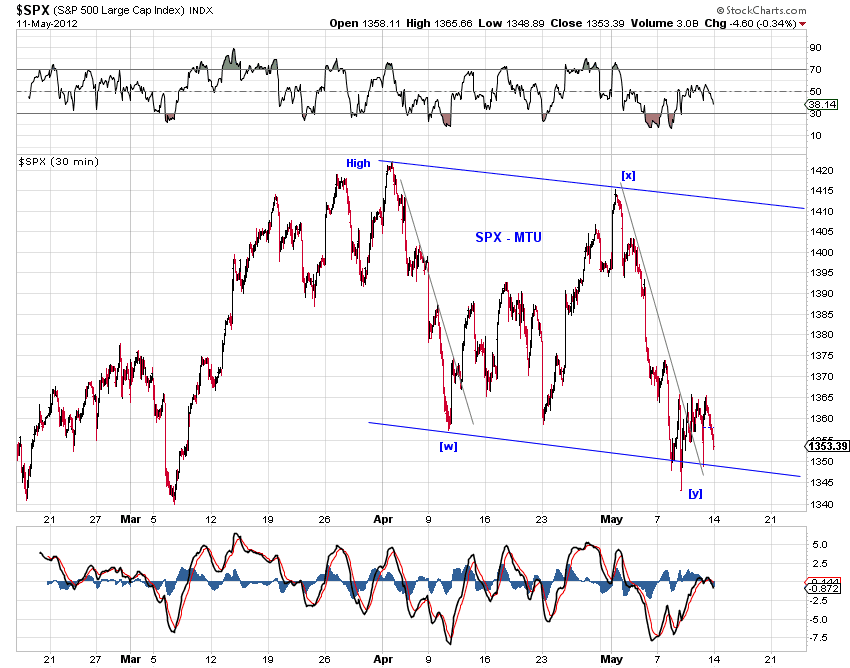
Meanwhile, SP500 continues to find support from a decade long support/resistance area (Chart 3) and appears to be wrapping up a two-month consolidation (Chart 4). Until this changes, odds appear to favor the bullish interpretation.


Moreover, price structures across major U.S. stock indexes have so far retained the "right look" of a 4th wave or B wave consolidation (Chart 5). In transports (Chart 5, bottom panel), we have what appears to be a lengthy triangle wave (B).


For near term outlook, please see Market Timing Update (5/11/12).


Market Timing Update (5/11/12)

[EOD] Stocks -
There's a well-formed five-wave advance from today's low to high. Whether it is a bearish terminal wave C or a bullish wave 1 requires further confirmation (Chart 1). From today's high, one can count a double-three decline for a regular five-down in SPX/INDU (Chart 2) but only a double-three in NDX (Chart 3). At the moment, wave structure of the decline appears to favor additional upside potential.


[115pm] SPX squiggles -
tracking counts from today's low.


[1040am] SPX update -
Short term tracking counts. See 2nd chart below.
[7am] ES update -
Bearish triangle (*red) or more bearish 1s2s (red) or bullish expanded flat (green)


Thursday, May 10, 2012

Market Timing Update (5/10/12)

[110pm] SPX squiggles -
Color-coded tracking counts from the nominal low. See the 2nd chart below.
[7am] ES update -
The larger picture.


Wednesday, May 9, 2012

Market Timing Update (5/9/12)

[EOD] Stocks -
Larger tracking counts remain unchanged - see this chart and this chart. For the near term, the main options are (1) a bullish rebound/new advance following a five wave decline (Chart 1, blue) (2) a bearish small-degree 4th wave (or B wave)  triangle (Chart 1, red)


[10am] SPX squiggles -
Potentially a more-than-previously-expected extended 3rd wave for the current decline.


[7am] ES update -
Options - Deep (b)/(ii) wave retrace, 4th wave triangle, 5th wave extension (expanding EDT or more bearish) or something more bearish. NQ is relatively stronger overnight.