long term outlook (SPX)
SP500 broke above its decade long resistance zone recently for a second time during this Hope Rally (
Chart 1). This time, the breakout has been accompanied by greater momentum and better progress relative to previously failed attempts since Y2K.
If SP500 can escape this resistance zone or successfully retest it and hold it as support, there should be meaningful upside potential whether the proposed Hope Rally is a corrective cycle wave b-up or a genuine bull run.
As failed patterns often feed strong moves in the other direction, the sell-off is likely deep and swift should this breakout fail. What are the odds of such failure? Here are some things to keep in mind.
[1] ECRI maintains its recession call and makes some good arguments. See "
Why ECRI's Recession Call Stands" (3/15/12).
[2] The monthly chart of SP500 is close to register a "death cross". The blue SMA50 is declining towards the rising red SMA200 in
Chart 1.
[3] If the wave structure of the proposed Hope Rally is corrective, whether a simple zigzag (
Chart 2 blue) or a double zigzag (
Chart 2 red), its approaching its end. On the other hand, the bull market count is indicated by
the green count in Chart 2.
The double zigzag should end as soon as a five wave advance since the November 2011 low ends (see near term outlook below).
The single zigzag has a wave 4 decline followed by a wave 5 advance once a five wave advance since the November 2011 low ends. Note that [C]=[A] is at 1378 which is the Feb 29th high prior to the Mar 6th low ; [C]=0.618[A] is at 1443.

 long term outlook (NDX)
NDX is coming up against long term trend channel resistance (
Chart 3). And as
Chart 4 shows, a five wave advance since its November 2011 low is ending. If the November 2011 low is indeed the end of wave (4)-down as indicated by the
blue count in Chart 3, odds of a reversal around current levels and around the trend channel resistance are favorable.

 near term outlook (SPX)
Three near term counts top our list for SP500.
[1] SPX is wrapping up wave (iii)-up of wave [v]-up since the November 2011 low (
Chart 5, blue).
[2] SPX is wrapping up the entire wave [v]-up (
Chart 5, blue).
[3] There's a smaller chance that wave [iv]-down is still in progress as an expanded flat or a triangle. Under this interpretation, the current high is wave (b)-up of wave [iv]-down (
Chart 5, red).
Chart 6 presents a squiggle count since the March 6th low to accommodate these counts.


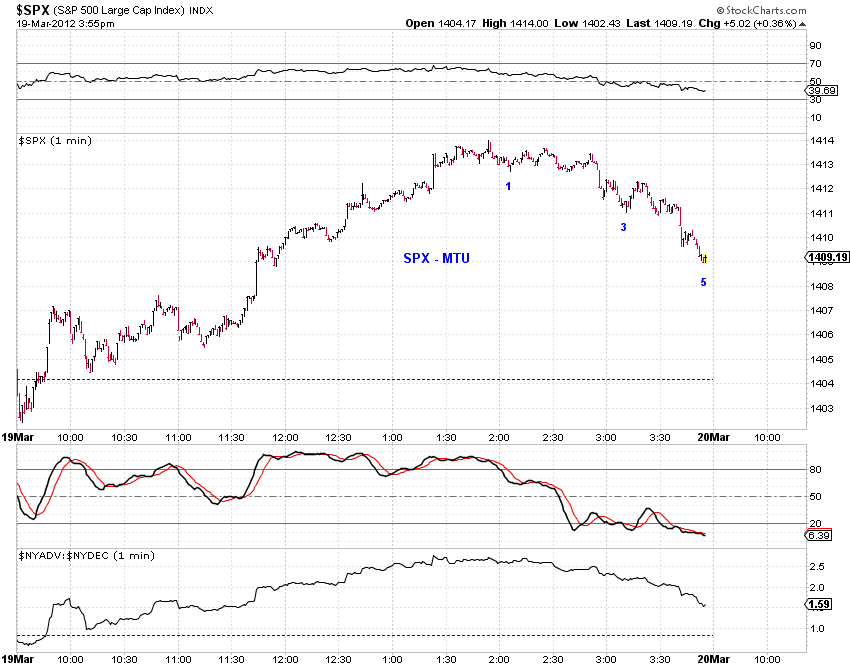
 Recent price actions in SPX suggest that a wave 4-down correction off the October 2011 low or an outright trend change likely has started (Chart 1).