Tuesday, November 8, 2011

Market Timing Update (11/8/11)

Note - Each count is usually color coded.

[340pm, EOD ] Stocks -
340pm - The green bullish count in INDU is intriguing (Chart 1, below), although it does not work well with SPX. At the moment, the market is at the overthrow territory of a potential EDT and at the mid-channel line. More after the close.

4pm - (Subjective) primary count is that a wave [x]-down retrace is still missing (c)-down.  The recent advance is (b)-up of [x]-down, perhaps better seen in GDOW (Chart 2, below).  While US stocks have retraced deeply in October and November, the "broader" GDOW has not yet done so.

Given the deep retrace in US and UK, I'd be monitoring London FTSE (Chart 3, right) for signs that negate the bearish count (i.e. Hope Rally is over - See the corresponding section in Intermediate Term Count Update (11/4/11)).


[1255pm] SPX/ES update -


[1130am] DAX at the close -


[725am] DAX, ES update -
Small degree C or 3 in progress in both DAX and ES

Monday, November 7, 2011

Market Timing Update (11/7/11)

[550pm] INDU update-
INDU showing "better formed" waves. Here's the big picture since the Oct. low.


[340pm, EOD] Bull and bear counts -
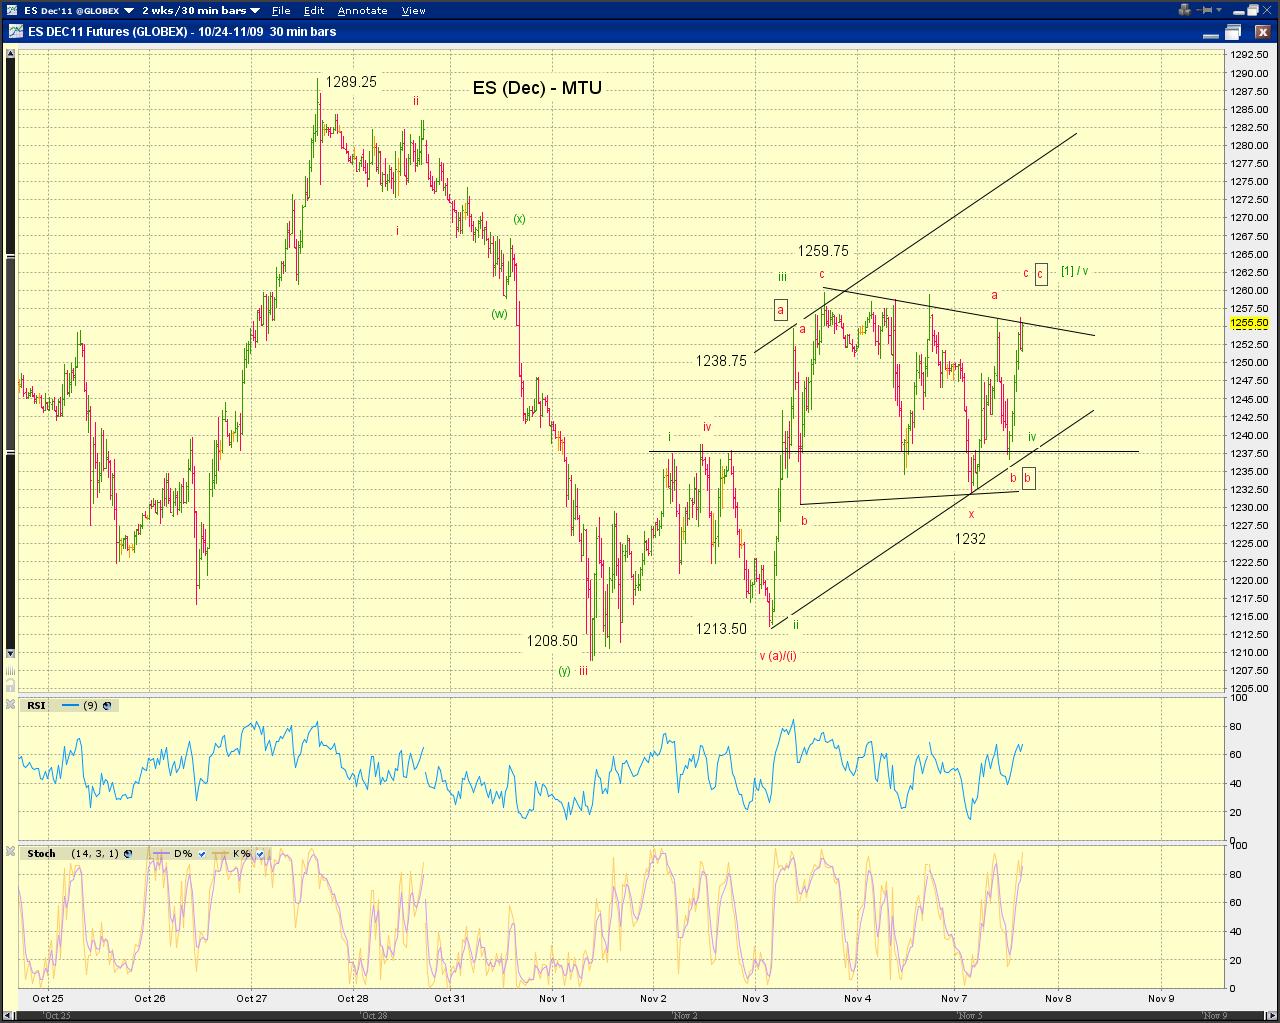
The structure in ES is telling. More after the close.
Bull - a tolerable five with a triangle 4th wave and minor overlap. Leave room for extension.
Bear - double zigzag (red), zigzag (boxed red)
Chart 2 shows the tracking squiggles on SPX cash.

[1140am] SPX update -
There are changes in the tracking counts as the market remains range-bound (see 835am entry). However, the wave structure is rich.
[835am] ES update -
Quite a turn-around from the AM low in ES. Multiple possibilities including the possibility of a truncated c*, a terminal triangle c** on the bearish side and a triangle [x] and a completed three x on the bullish side, all depending on which side of the congestion area ES breaks out.

Saturday, November 5, 2011

MTU Weekend Ed. - Intermediate Term Count Update (11/4/11 Close)

Large stock market swings millennium to date, particularly those in 2011, have produced enough structure to shed additional light on the intermediate term path of U.S. stocks. It’s a good time to gather our thoughts. Please see The Big Picture (U.S. Stocks), updated June 2011 for discussions on the long term count.

Top long terms counts can be categorized as follows.
(1- new bull market ) The 2009 low marked the beginning of a new bull market, impulse wave advance in EWP terms.
(2- hope rally is still in progress) The 2011 sell-off is a major yet a mid-term correction of a corrective rebound against the 2000-2009 decline.
(3- hope rally is over) The 2011 sell-off marked the resumption of a major bear market dating back to 2000.

I have some thoughts regarding which scenario is more likely, but it is prudent to let the market speak for itself. Here are some details. In all cases, please note the role of a decade-long support-resistance zone going forward.

It's a new bull market (Chart 1)
It’s reasonable to label the 2000 top as the end of a third wave, given the sideways nature of the
bear market over the following decade. Under this interpretation, the 2000-2009 correction, a fourth wave, takes on the structure of an expanded flat. However, there is much ambiguity surrounding the degree of the proposed third wave. As a result, there is much ambiguity surrounding the ultimate upside potential of the fifth wave in progress. See Chart 1.


Hope Rally is still in progress (Chart 2)
The 2000-2009 bear market, an expanded flat, is labeled as wave a (or w) of a much larger correction. The rebound since the 2009, the Hope Rally, is wave b (or x). Once the Hope Rally is over, a wave c (or y) decline is likely to push the market to new lows.

However, the 2011 sell-off is a major yet a mid-term correction of the Hope Rally. Two top counts are worth noting.

(green) The October 2011 low marked the end of a running flat or an odd looking (W)(X)(Y) correction dating back to the 2010 high. The current upswing will break above the decade-long support-resistance zone to complete a large zigzag-like [A][B][C] structure. Wave [C]-up can end below or above the 2007 high - that’s the nature of b waves.

(blue) The May 2011 high marked the end of an initial zigzag-like structure as [W]. The decade-long support-resistance zone where the market is current approaching is likely to offer resistance and induce a wave (C)-down of [X]-down. Thereafter, the final zigzag-like structure as wave [Y] will possibly produce an inverse head-and-shoulder pattern around the decade-long support-resistance zone and then push the market to new recovery highs.

Hope Rally is over (Chart 3)
The 2011 high marked the resumption of a bear market dating back to 2000.

Two top counts are worth noting. The 2009-2011 rebound, the Hope Rally, is wave b (or x) under one count and wave [2] under the other. The key differences between the two counts are the magnitude (large vs. huge) and wave structure (proportionate vs disproportionate three waves) of the resumed bear market.

(blue)
The 2000-2009 bear market, an expanded flat, is labeled as wave a (or w) of a much larger correction. The 2009-2011 rebound, the Hope Rally, is wave b (or x). A wave c (or y) decline is in progress and is likely to push the market to new lows in a proportionate three wave structure.

(red)
The 2000-2009 bear market is an incomplete expanded flat with the 2009 low as wave [1]-down of wave c-down. The 2009-2011 rebound, the Hope Rally, is [2]-up of c-down. Wave [3]-down is in progress, which is likely to be large and forceful.

Friday, November 4, 2011

Market Timing Update (11/4/11)

[EOD] Stocks -
tracking counts, particularly those on the ES
[150pm] DAX and SPX update -
DAX - DAX has chance for the next wave C / 3 down, if the market sells off into the close and/or over the weekend. Otherwise, at least another move up based on the purple count (a small "zigzag" or a larger triangle 4th wavehttp://www.blogger.com/img/blank.gif?) or something more bullish. See this chart for the larger count.

SPX - various options, but the bearish counts are almost running out of time on a higher high.
[1130am] SPX squiggles -
One more lower low to make it a five down from the recent high. See the 2nd chart below.

[830am] ES update -
A small degree 5th wave after the jobs report or the second part of abc-x-abc.

[735am] DAX update -

Thursday, November 3, 2011

Market Timing Update (11/3/11)

[EOD] Stocks -
Squiggle count and the larger count refreshed. See charts.
[1230pm] DAX at the close -
See this chart for the larger count. The 2nd chart below shows the tracking squiggles.
[1130am] SPX squiggles -
ES still below its AM high at the moment.
[950am] SPX update -
Let's see which way it leans, red, blue or green.See the 2nd chart below.

[830am] NQ update -
A possible hint that low is in based on a potential expanded flat correction in NQ.

[640am] ES, DAX update -
ES - flat or something more bullish

Wednesday, November 2, 2011

Market Timing Update (11/2/11)

[EOD] Stocks -
Chart 1- Primary count is a small-degree corrective rebound in progress (red/blue), with the alternative of a low in place (blue-green).
Chart 2- Larger count.
As mentioned in the weekend commentary, leave some room for a more complex wave (2)/(B) rebound if the low is not in.
[115pm] SPX squiggles -
See the 2nd chart below.
[1pm] DAX at the close -
Appears to be a wave b/B/[ii] rebound into the close.
[1110am] SPX update -
[8am] DAX, ES update -
ES - overnight high likely the end of wave iv or another wave (x)

Tuesday, November 1, 2011

Market Timing Update (11/1/11)

[EOD] Stocks -
Primary options are [ii]-down of 3-up, X-down of 2-up, and 3-down (Chart 1). The decline from the high appears to be 7 waves so far (Chart 2), with INDU breaking into a lower low during the PM sell-off and AM low in SPX intact. Sometimes, the anticipated 5th wave never comes and sometimes counts are rushed. But the bullish divergence on the 30-min frame (Chart 1) should be noted.

Also, VIX surged 4.81 index points (+16.06%). Whether it is the start of another bull run or the end of a small-degree expanded flat remains to be seen (Chart 3). It's prudent to monitor both options.
[130pm] DAX update and SPX squiggles -
see the 2nd chart under the 1110am entry for updated SPX squiggles
[1110am] SPX squiggles -
5 or 7 waves down from the top in SPX cash, hope to be able eliminate some counts later today.
[940am] Euro update -
Regarding the appreciation of the euro in October, is it a better five (black) or better three (red)? You be the judge. See the 2nd chart below.

[920am] NQ update -
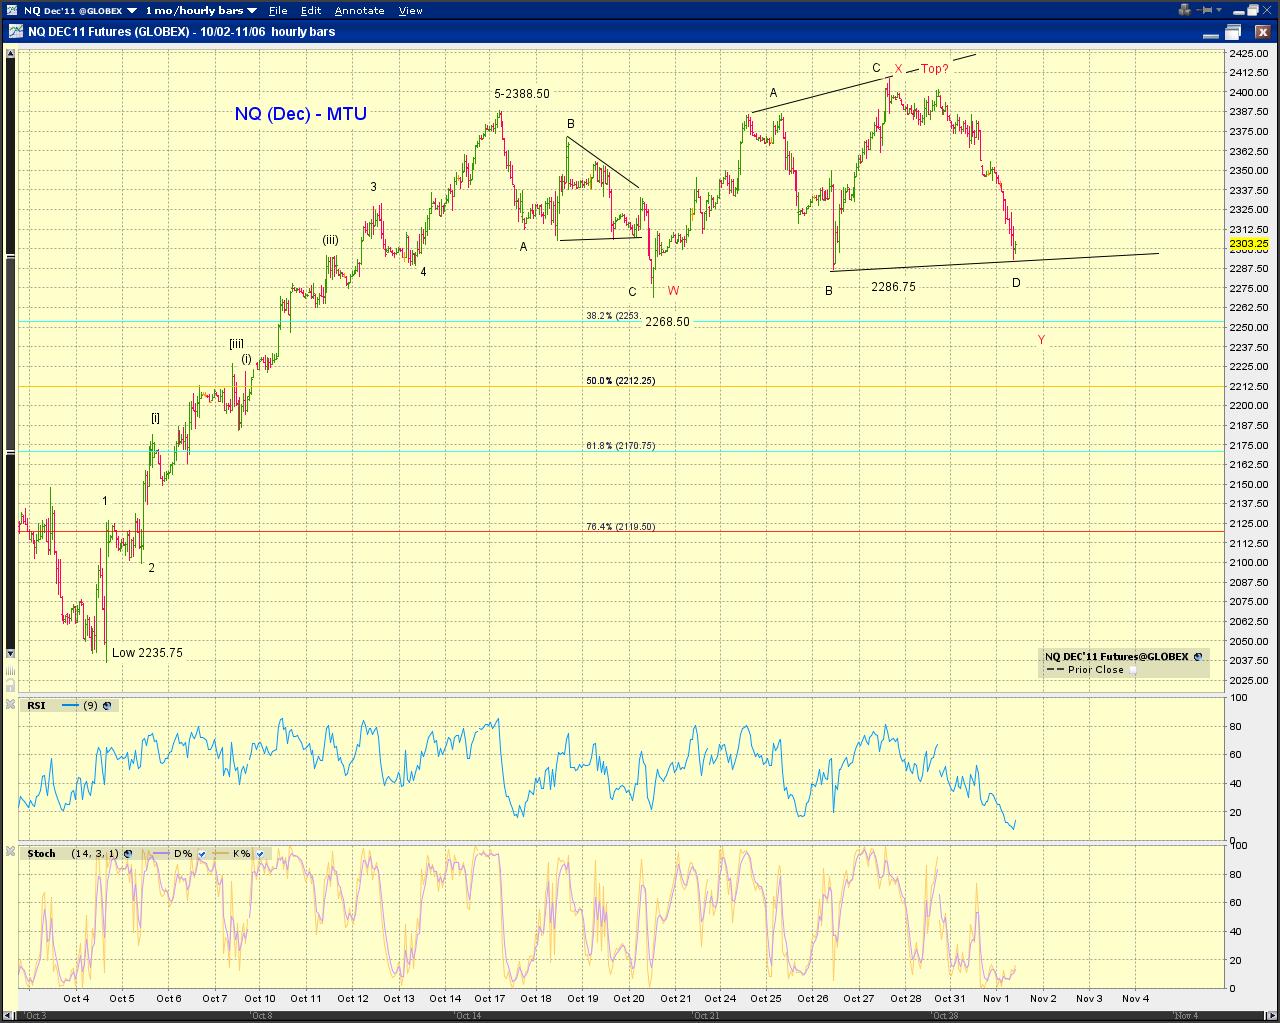
Expanded flat, rare expanding EDT, topped?
[830am] DAX, ES update -
DAX - retracing at least a five up since late September, possibly a flat since mid September
ES - at least a near term trend reversal, prudent to leave room for a complex wave (2)/(B) rebound as discussed in Points of Recognition (10/28/11).
Green tracks the immediately bullish count as [ii]-down of 3-up. Blue/Red track the bearish count.