Stock market update 
The broad stock market is in between important support and resistance levels.
A significant 10-year resistance zone (1313-1330) lies ahead. The market sold off sharply around these levels in 2001 and 2008 and pulled back moderately in 2006 (
Chart 1.) Note that the February high in SPX is 1310.87. If the market can break above this resistance zone and turns it into a support zone, meaningful upside potential is likely.
At the same time, the late January low (e.g. 1275.10 in SPX) in stocks is a key support level. If that support level is breached fairly soon without a reasonable advance first, a correction of the advance since at least the July low is likely in progress.
Please see additional discussions on corresponding wave structures and potential targets in "near term assessment" below.
 A potential x wave
This section extends the analysis in
Dip or Top (1/28/11) from RUT to the broader market, on observations that
(1) At its recent high, the Russell 2000 Small Cap Index is only 48.59 index points (or 6.01%) away from a fresh all-time high,
(2) The S&P 400 Mid Cap Index has already recovered to a new all-time high (Chart 1, 3rd panel),
(3) The broader stock market, while still meaningfully below its 2007 peak partially due to weaker performance by financials (see
Were it not for financials … (1/21/11)), continues to sub-divide higher.
The likelihood that the current advance is an x wave has been rising (
Chart 2.) Theoretically, the proposed x wave can theoretically end either below or above the 2007 peak. It can either take on a simple form (as it has so far) or can become complex and extend in time. Therefore, there’s a great amount of uncertainty regarding the timing and the level of the end of the proposed x wave.
At the same time, it remains premature to exclude the drastically different scenarios that the advance over the past two years is EITHER a 2nd wave advance for the broader market OR the beginning of a multi-year impulse wave advance (see
The Big Picture (2/21/10)).
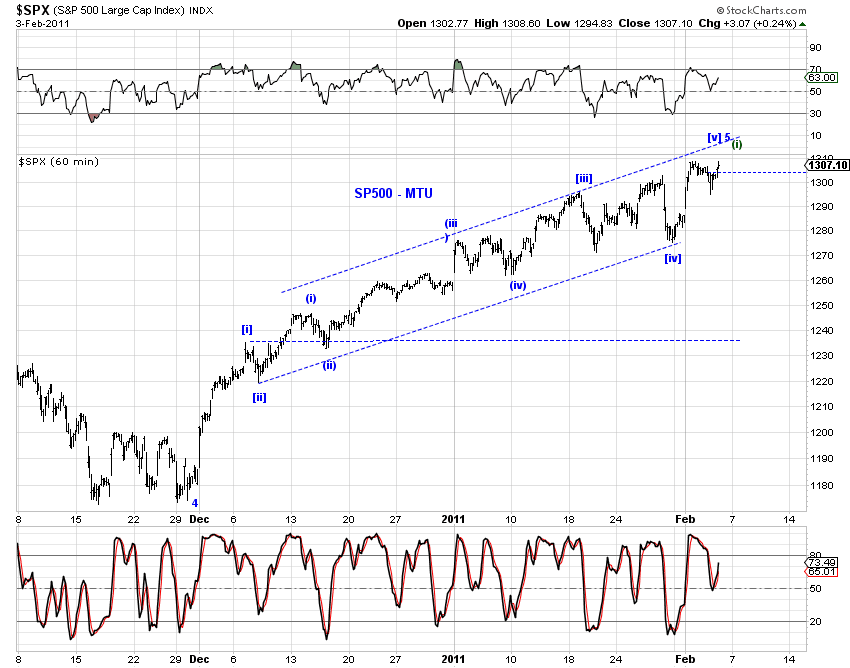
Near term assessmentThe late January low (e.g. 1275.10 in SPX) in stocks is a key support level. As the two top counts in
Chart 3 and
Chart 4 show, the market is either wrapping up the advance since the July low (
blue count) or is still within an extended 3rd wave of this advance (
green count).


If the less bullish blue count plays out, a meaningful pullback should be in sight. An immediate decline below the late January low of 1275.10 in SPX will significantly increase the odds that a correction of the advance since the July low is already underway. As
Chart 1 shows, a significant 10-year resistance zone (1313-1330) lies ahead. The market sold off sharply around these levels in 2001 and 2008 and pulled back moderately in 2006. Note that the February high in SPX is 1310.87.
If the more bullish green count plays out, pullbacks will likely remain moderate and respectable upside potential exists. If the market can break above the 10-year resistance zone and turns it into a support zone, meaningful upside potential is likely.
In that case, a potential target for the end of minor wave 3 is around 1350 but it should not exceed 1398 as [iii] of 3 is shorter than [i] of 3.
After a potentially sideways minor wave 4 correction to alternate with minor wave 2, minor wave 5 could advance the SPX another 100 index points since minor wave 1 is 118.33 index points.


 [EOD] Stocks -


 [1130am] Mid-day update (SPX) -
 [815am] Overnight update (stocks) -