Disclaimer: Each post is for informational purposes only. It is not a solicitation, a recommendation or advice to buy or sell any security or investment product. Information provided in each post does not constitute investment advice.
Saturday, May 14, 2022
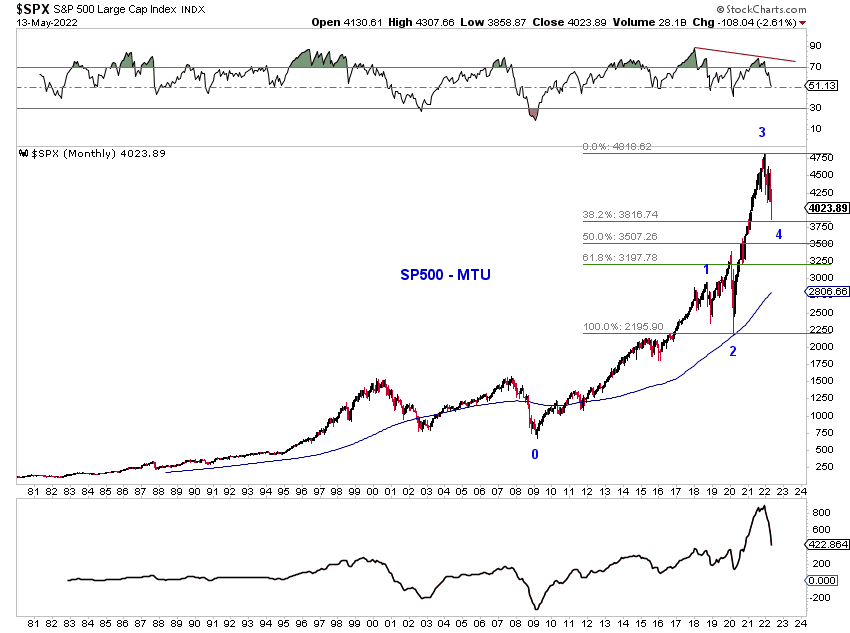
MTU Weekend Ed. - Wave Four (5/13/22 close)
Based on the steepness of the advance since the 2020 low and the corrective pullback from the 2022 high, the possibility of a fourth wave looks reasonable and interesting. This structure is more obvious on a arithmetic-scale chart of SPX.
If in fact the wave from 2009 to Nov 2021 is a 5 waver, your blue 1 2 should be 3 4.
There are valid reasons for this given the entire pattern.
But if the 5 waves end in Jan 2018, and the 2018-20 is the A wave and the large rally is a B wave, then C is in progress.
The thing to remember is the 2000-09 period is mostly a double wave 4 from 1932.
There's clearly 5 waves somewhere in the 2009-2021 range, but is it part of a new larger deg 5 waver or not ? Or is it wave 5 of 5 from 1932 or 1982 (or 1949 as Neely would have us believe).
If in fact the wave from 2009 to Nov 2021 is a 5 waver, your blue 1 2 should be 3 4.
ReplyDeleteThere are valid reasons for this given the entire pattern.
But if the 5 waves end in Jan 2018, and the 2018-20 is the A wave and the large rally is a B wave, then C is in progress.
The thing to remember is the 2000-09 period is mostly a double wave 4 from 1932.
There's clearly 5 waves somewhere in the 2009-2021 range, but is it part of a new larger deg 5 waver or not ? Or is it wave 5 of 5 from 1932 or 1982 (or 1949 as Neely would have us believe).
Err correction - should read "most likely a double wave 4"
DeleteThis post highlights the possibility that 2009 to 2021 is only a 3 waver. One of several scenarios worth monitoring.
DeleteWell why have you got a blue 4 there if its a 3 waver ? (I presume you mean an ABC by saying 3?)
DeleteIf it is a 3 waver the blue 1 2 needs on timing to be somewhere in the mid time zone, which it isnt. Refer past 3 wavers.
The rate of the advance since 2009 looks on the face of it a long term blowoff. Vertical moves (Gann's 8x1 angle) do not last forever.
Anyway we will see.