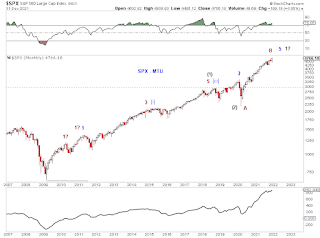
Still three waves down from the high, so far (Chart 1), and how it can fit into the 3 potential larger structures (Chart 2).
Disclaimer: Each post is for informational purposes only. It is not a solicitation, a recommendation or advice to buy or sell any security or investment product. Information provided in each post does not constitute investment advice.
Saturday, January 29, 2022
Saturday, January 22, 2022
MTU Weekend Update - Tracking the Big Structure (1/21/22 close)
In SPX, the decline from its ATH has been 3 waves so far.
Tracking counts relating to the large structure in SPX remains.
[Red] Wave B-up. May have ended - we've observed recently that there have been enough waves to complete the wave. If the top is in, it is better to count Wave B-up as a zigzag rather than a triple zigzag (See chart). A correction to the 2020 low or beyond is next.
[Red] Wave B-up. The current decline can be the end of an [x] wave in a triple zigzag. In this case, wave [y]-up of B-up is next.
[Blue] An impulse from the 2009 low. The current decline is wave [iv]-down of wave 5-up.
[Green] Wave 1 up from the 2020 low is you have a super bullish outlook. The current decline is wave [iv]-down of wave 1-up.
Saturday, January 15, 2022
MTU Weekend Ed - Wedge Details and Morphing (1/14/22 close)
In out 1/7/22 close update -
"In the context of a triple zigzag - see last weekend's update on the longer term structure - there are now enough structure for a high, but also room for further more development, including a potential EDT from the October low in SPX. "
As of 1/14/22 close -
Chart 1 updates details on a potential EDT from the October low in SPX. Internal structure of the A of the wedge is ambiguous, which raises questions about the validity of an EDT. The Dow made a lower low for the month this past week and SPX did not. Chart 1 also shows the invalidation and upside levels.
If the wedge gets invalidated, a major high could be in (at the red H) in the context of a triple zigzag.
Chart 2 updates the triple zigzag.
Note that this triple zigzag has room to extend in time and price. It's possible that the second (X) is not the October 2021 low [blue (X)] but a potential low in Feb/Mar 2022 [green (X) potentially testing SMA200]. In that scenario, SPX could be in the middle of this flat-like (or even triangle) structure.
Sunday, January 9, 2022
MTU Weekend Ed. - A final wedge? (1/7/22 close)
In the context of a triple zigzag - see last weekend's update on the longer term structure - there are now enough structure for a high, but also room for further more development, including a potential EDT from the October low in SPX.
Sunday, January 2, 2022
MTU Weekend Ed. - Wish You a Safe 2022 (12/31/21 close)
Three visual possibilities for the large structure from the 2009 low.
But it is not easy to track an impulse from the 2020 low.


