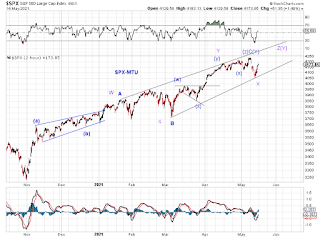
In SPX, (Y)-up we've been tracking could have ended at the current high - IF the final zigzag (z)-up is tiny as marked in blue.
Typically, it's likely that SPX is extending as suspected in the form of a larger triple zigzag as marked in purple.
SPX bounced off support and closed the week inside prior range, so did ES.


On chart 2 above (2020-curr) note that time period of wave blue C-W has just balanced out been past at recent peak in wave X-Y. Rule of thumb says watch this area.
ReplyDelete