No need to change the lables on the last Weekend Ed. - Divergence (3/20/21)
Disclaimer: Each post is for informational purposes only. It is not a solicitation, a recommendation or advice to buy or sell any security or investment product. Information provided in each post does not constitute investment advice.
Friday, March 26, 2021
Saturday, March 20, 2021
Weekend Update - Divergence (3/19/21)
SPX prices have been diverging against select indicators in recent weeks. Meanwhile, the pullback this past week has been a three so far.
Saturday, March 13, 2021
Saturday, March 6, 2021
Weekend Ed. - 3 waves down (3/5/21 close)
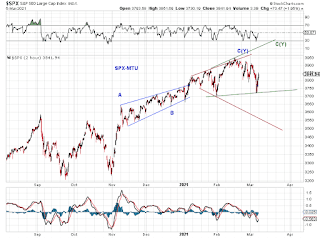
Chart 1 - SPX saw a three-wave down so far from its ATH (blue C) or high at a potential failure (green C). It does not rule out a reversal, in view of the Higher Degree Tracking (2/26/21). For example,
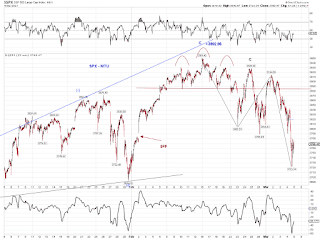
The ATH could have marked the end of a megaphone (Chart 2, red)
Waves down from the blue C can morph into a larger flat-down.
Waves down from the green C can morph into an expanding LD-down.
Chart 2 - However, support has held and SPX rebounded vigorously Friday. SPX could be in the final zigzag up of an expanding diagonal (green C(Y))
Chart 3 - A double-three looks better than a triple-three based on time. Note that the first three lasted 5 months, the current three lasted 4 months, (going for 5 months at the second C(Y).)
Thursday, March 4, 2021
Thursday Update (3/4/21)
Three waves down so far from he ATH (blue C) or a potential failure high (green C) discussed before (Chart 1).
SPX closed at a couple of trend-line support levels and is yet to break the late Jan low. On support failure, SPX has potential to hit the 200DMA, currently around 3465 (Chart 2).


