[EOD] Stocks-
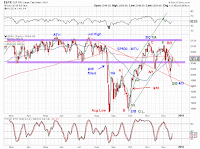
SP500 closed above its MA50 as well as MA200 (Chart 1). Near term, SP500 is wedging at a couple of degrees (Chart 2). The current advance is tracked as the blue wave [i] of a new upswing or the red wave [c] of an expanded running flat rebound.
[950am] SPX update-
Fed Day. SPX is within 2 points of a golden cross. At the same time, both MAs represent potential overhead resistance. See charts for tracking counts and squiggles.


