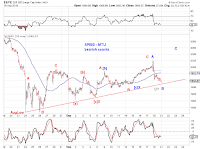
From a bearish perspective, the rebound could be over on the breakout failure (Chart 1), a kiss-and-goodbye with respect to a key overhead resistance (Chart 2), and a potential ABC-X-ABC wave structure since the August low (Chart 3, subject to potentially one more blue wave C advance, which is not required).
All is not lost from a bullish perspective either. An unfilled gap remains above this past week's high (Chart 2). A number of odd-looking bullish counts since the August low catch one's attention (Chart 4).
[red - this one is an interesting possiblity] An LDT off a potential orthodox low .
[green] A disproportionate impulse wave whose wave [iv] triangle is just unfolding.
[blue] An imperfect impulse wave whose wave [iv] marginally overlaps wave [i] in this volatile period.
[gray] An odd shaped LDT.
On a higher time frame, one observes that the post-FOMC pullback could be an attempt to probe the purple trendline as well as the green mid-channel line for potential support (Chart 5). Will support hold?


