Stocks, Bonds, USD, Gold - key intermediate scenarios to watch
Stocks
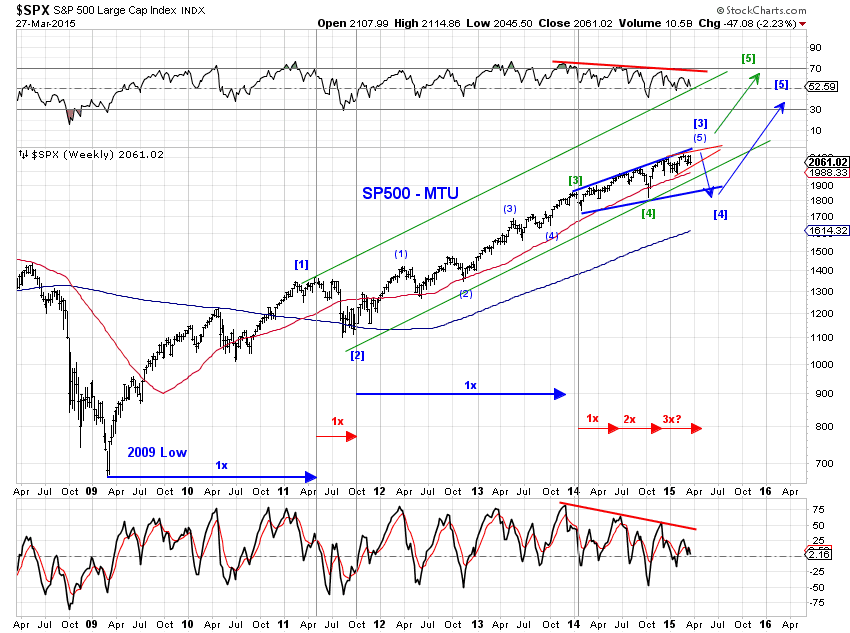
Several benchmark stock indexes (SP400, Nasdaq Composite, Russell2000) made new recovery highs in March while senior indexes (SP500 and the Dow) came very close but failed to do so. The subsequent sell-off into the month end has been swift and sizable and succeeded in breaching the March lows in the Dow, Nasdaq Composite and Transports. See Chart S1.
Price actions appear to favor the current sell-off completing a pullback rather than initiating a larger downtrend. One possibility is that SP500 is completing wave [d]-down of a small contracting EDT since October 2014 (Chart S1 blue lines) in the context of a large expanding EDT since January 2014 (Chart S2 blue lines). Under this interpretation, wave [e]-up is likely to push SP500 to new record highs (perhaps around 2150) in 2015Q2.

In addition, the month of April has been exceptionally supportive of stocks from the perspective of the decennial cycle and the presidential cycle. Chart S3 and Chart S4 illustrate.


The bearish alternative scenario is that the proposed blue wave [3] (or C) topped out at either the February high or the March high. This is a scenario to keep an eye on, but appears less likely at the moment.
Bonds
The two long term scenarios in the 10-year treasury yield index we’ve been tracking remain unchanged (Chart B1).
The blue count suggests a new record low in long-term interest rates to complete a multiyear EDT (blue wave #11). The green count saw a cycle low in long term interest rates had in 2012 (green wave #13) and long term rates trending higher over time (Chart B2).
Price actions appear to favor the bearish (in price) green count.
For the very near term, the March low in yields could see a retest. However, a retest or the absence of which has little impact on the two long term scenarios.


USD
The USD index printed a topping candle in March (Chart $1) which appears to be supported by a potentially completed 5-wave run in the lower time frame (Chart $2 blue).
If a wave 4/D pullback is in progress (Chart $1 green), it can retest the 90 area or even the 85 area.


 If USD is unable to break out of potential long term resistance (Chart $3) and has topped (Chart $1 red), a multi-year decline is likely.
Gold
The 3 bearish and 1 bullish scenarios on gold (Chart G1) we’ve been monitoring continue to track. Under this interpretation, the $60 rebound off the March low is likely either a small-degree B-wave of the green wave C or the red wave C or a small-degree wave 2 of the black wave C on the bearish side. On the bullish side, the recent rebound can morph into a wave 3 (Chart G2). Let’s see which side Gold price breaks out, the 2015 high around 1308 or the March low around 1141.

