Stocks, bonds, USD, gold, Nikkei
Stocks
 As discussed in detail in Bull or Bear (5/24/13), the May high is likely one of the last three logical termination points of the Hope Rally before one should emphasize a larger degree bullish interpretation. We illustrate these three logical termination points with blue arrows in Chart 1. Please see Bull or Bear (5/24/13) for additional analysis.
 SP500 is approaching a small-degree wave [iv] support if the current sell-off is wave [iv] (Chart 2, green). Under this interpretation, the sell-off since the May high counts as a double three or a flat (Chart 3).
If the May high is a larger degree top (either the blue (3) or the red (5) in Chart 1), SP500 should quickly sell off to show the might of a small-degree 3rd wave decline (e.g. blue [iii] in Chart 2).


Bonds
We continue to focus on the 10-year U.S. Treasury yield. Our tracking counts suggest that 10Y yield either bottomed at the 2012 low (Chart 4, green) or the current sell-off (rise in yield) is only a consolidation within the last leg of a larger ending diagonal triangle (Chart 4, red, B-up of (E)-down).
Chart 5 presents our tracking counts on 10Y yields since the 2012 low. The sell-off in 10Y UST since then is so far a three-wave structure in the form of impulse-expanded flat-impulse.


USD
There's no change in the large wave structure of the USD index, except that we decided to move wave [c] of the blue bearish triangle and wave [d] of the green bullish triangle to around the current high for better form. See Chart 6.
Chart 7 presents the tracking counts since the 2011 low. The red count suggests a triple three, which accommodates the larger triangle counts highlighted above. The blue count tracks a regular five which accommodates the black upward flat in Chart 6.


Gold
The primary tracking count on gold is a fourth wave pullback (Chart 8) as discussed before. The proposed pullback is currently around a fib-0.382 retrace and approaching its 2-year anniversary.


The proposed retest of the April low discussed in Monthly Outlook Update (4/26/13) did play out. Chart 9 presents near term tracking counts as we anticipate the end of the proposed fourth wave pullback which has likely taken the shape of a flat.
Depending on which small-degree wave is extending or no extension at all, potential support levels are around the April low and 1100.
[red - extended wave 3] Wave 3-down from the 2012 high is in progress. The market is only at wave [iii]-down of 3-down. Gold price is heading toward 1100 as wave (C)-down unfolds.
[blue - no extension] The pullback is effectively over at the April low, with a minor breach of that low still a possibility.
[blue alt - extended wave 5] Wave 5-down from the 2012 high is in progress, but is extending toward 1100.
Nikkei
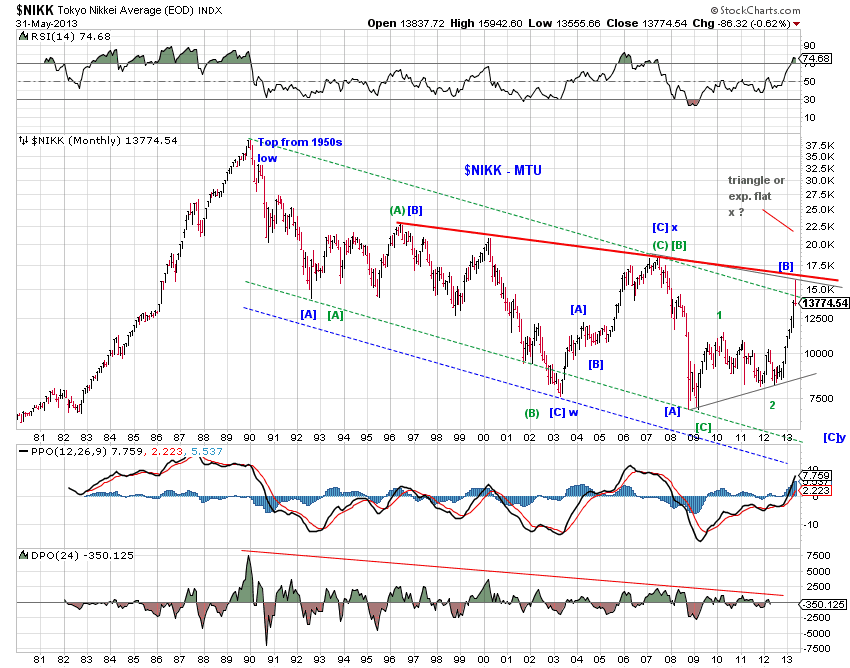 The Tokyo Nikkei Average has experienced a frenzied monetary-policy-induced upswing. The performance chase came to an abrupt halt in May and the Tokyo Nikkei Average is now down about 15% from its recent peak and is back inside its long term bearish channel. Note that the May peak ran up against major resistance as it conveniently hit a 17-year trend line which connects three major tops in 1996, 2000 and 2007 (Chart 10, red trend line). It often takes major effort to breach such major resistance.
 Chart 10 also presents long term tracking counts on Nikkei since its 1980s top, which are straightforward.
[blue - immediately bearish] The current sell-off marks the beginning of the last wave [C]-down of a large [A][B][C]-x-[A][B][C] bear market. It’s probable that the ultimate low can truncate but it is certainly not required and premature to forecast.
[green - bullish] The bear market was over at the 2009 low in a [A]-expanded flat [B]-[C] structure. Nikkei is subdividing higher (potentially in a series of 1s and 2s) in a new bull market. However, for the bullish count to track, the major resistance around the May high needs to be taken out.
[gray - lengthy consolidation and eventually bearish] Nikkei is tracing out a triangle or expanded flat since its 2003 low. Once the consolidation is over, another [A][B][C] decline is necessary to complete the bear market.