Stocks, Bonds, USD, Gold - key intermediate term scenarios to watch
Stocks
In contrast to the rebound from the Sep/Oct low in stocks, the rebound from the November low has been led by small-to-mid-cap stocks, which is (near term) bullish (Chart S1).
However, if the rebound from the November low is the green wave 5 in Chart S2, this wave 5 has the potential to fail or to extend (See Extension or Truncation (11/20/15)).
Even in the case of an extension, the squiggle counts in Chart S3 suggest that the green wave [ii]-down of wave 5-up or the red wave [x]-down have room for one more pullback. This would be consistent with the implication of a small-degree impulse-wave decline in SP500 emini futures (Chart S4).
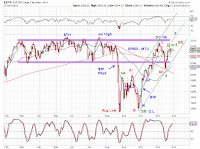
Chart S5 updates the scenarios where the proposed wave [4] off the 2009 low or the 2010 low is over (green) or not (blue and red).
Bonds
10-year U.S. Treasury yield has retreated from the right shoulder of a potential head-and-shoulders pattern (Chart B1) and is now retesting the gray break out line. Logical initial targets are around 2.5% or 1.95%, depending on whether the retest succeeds or fail. There has been little change in the long-term profile of yields (Chart B2)
USD
The USD index is forming a potential ending diagonal triangle (Chart $1). Unless a green wave [v] is already underway (which appears less likely), the potential EDT suggests at least a pullback. The initial target would be slightly below the 99 level.
Gold
Gold prices fell to a new bear-market low over the past month, as suspected. Based on Gold's price actions, the likelihood of a 3-year EDT has meaningfully increased (Chart G1, green). Under this interpretation, we expect gold to rebound in a small degree (b)-wave, followed by a small-degree (c)-wave decline to a lower low above $956.20 to finish off this potential EDT.


