One reason why SP500 is so far unable to make a new all time high is the mega-caps which are still 4.6% below their 2007 high. A near term top is approaching, which also has the potential to mark a top at several larger degrees. We also discuss the best bullish count at larger degrees.
SP500 internals - mega caps lagging
 At its recent high, SP500 is only about 13 index points away from its all-time high. The majority of leading benchmark indexes have now exceeded their 2007 peaks. It’s reasonable to expect that SP500 is making and will make an attempt at a new high. However, whether SP500 makes a new high is less relevant in the context of a potential b-wave top (New All Time High (3/8/13)).
However, it is interesting to note that it is the mega-caps that are holding SP500 back from its all time high. Chart 1 shows that SP500 is now at the high end of its trading range and VIX at the low end of its trading range dating back to year 2000 and more. The equal-weight SP500 index is already 14.5% above its 2007 peak driven by lower-cap constituents. SP400 mid-cap index, which has been historically strong in upswings, is 23% above its 2007 peak. However, SP100 mega-cap index, which have lagged in 2007, is still 4.6% away from its prior top.
Near term top approaching
We observed in New All Time High (3/8/13) that, "Regardless the larger count, a five-wave advance since the November 2012 low is approaching its end. A partial or more likely full retrace is likely to follow."
This past week’s market action continues to support this scenario. As Chart 2 on SP500 and Chart 3 on DJ Transportation Average show, the proposed five-wave advance is looking increasingly mature. So one simply waits for its conclusion.


A potential top at several larger degrees
The pending high has the potential to mark a top at several larger degrees.
[1] It concludes a regular five-wave advance since the November 2012 low as Chart 2 illustrates.
[2] It potentially completes an overlapping 7 wave advance since the 2011 low, in the form of a double zigzag (Chart 4).
[3] It potentially terminates the Hope Rally since the 2009 low in the form a triple-three or a double-three (Chart 5).

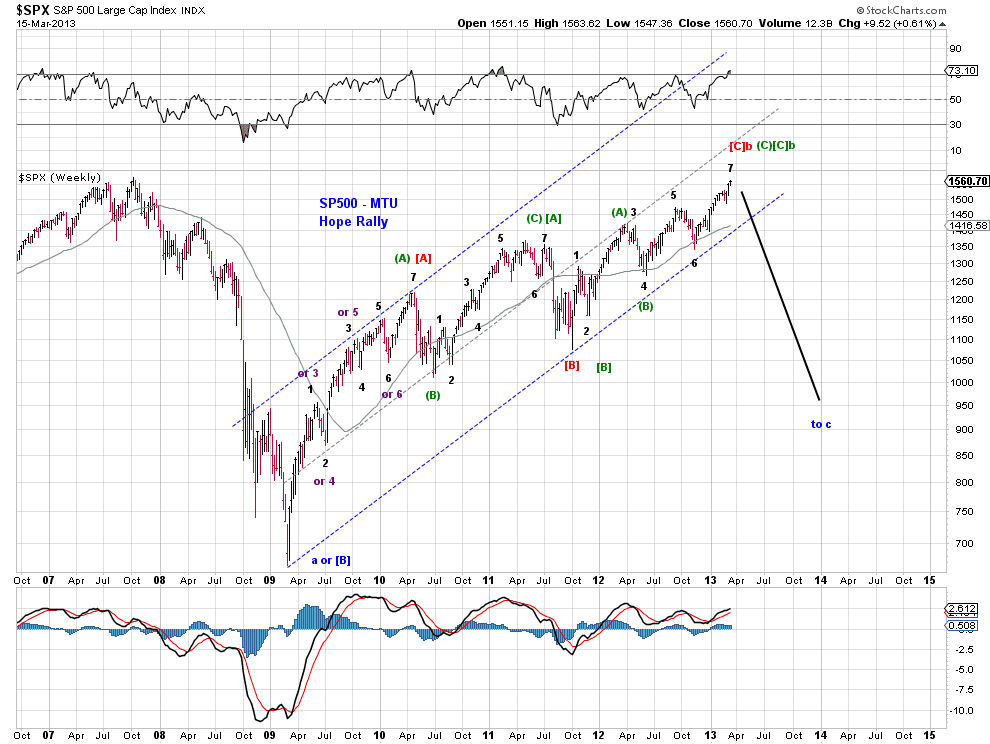
The best bullish count at larger degrees
We also observed in New All Time High (3/8/13) that, "A bullish interpretation would label the rally since 2009 as a nascent supercycle-degree wave (V) advance. However, wave structures associated with the rally to date are far from convincing. Other than the potential of a set of nested 1st and 2nd waves, wave structures over the past four years does not describe an impulse wave. Time will tell."
 That observation leaves us with a potential (leading or ending) diagonal triangle as the best bullish alternative count for the Hope Rally. Chart 6 illustrates.
A bearish EDT would potentially serve as primary wave [C] of cycle wave b, OR supercycle wave (V) all together. See long-term charts in New All Time High (3/8/13) for these larger waves.
A bullish LDT would potentially serve as cycle wave I of supercycle wave (V).
Regardless of the larger wave interpretation, the pending high is likely wave (C) of the proposed diagonal triangle (Chart 6, black) or to a lesser extent, its entirety (Chart 6, red). A full or near full retrace of the advance since November is likely. The personality of the proposed decline will shed light on the larger count.