 Early this week, U.S. stocks suffered a downside breakout out of the inside week discussed in Consolidation (5/13/11), in an attempt to fill the massive upward April gap. The gap was defended and SPX also rebounded from the edge of a decade-long resistance/support zone discussed in Breakout (4/29/11). Note that the lower edge of this decade-long resistance/support zone is around 1313 which is also the April gap and this past week's low is 1318.51 in SPX. A multi-week consolidation around this potential new support has continued (Chart 1).
The stalled price action is perhaps another indication that the end of an x wave rebound from lows during the financial crisis in stocks is approaching. Chart 2 updates the top tracking counts (blue, gray and red) within the context of the proposed x wave, as well as a very bullish count (green).
These counts have been discussed in the recent weekend commentaries. What's new?
 The overlapping nature of the wave structure since the March low has now introduced the possibility of
[1] a rare expanding ending diagonal with respect to the red count
The wave structures in the DJ World Stock Index and the Global Dow Index appear to support some kind of ending diagonal. See Chart A and Chart B below.

 [2] a leading diagonal with respect to the blue count and the bullish green count.
[3] a bullish 1/2/1/2 setup for the blue count and green count.
Note that the starred blue and green counts, (B)* and 2*, accommodate more near term downside potential.
In the near term, stocks are likely finishing an A-B-C decline from this week's high with a complex B wave - see Chart 3, 4 and 5 below.


Follow-through: USD index
The USD index put in a low in April. The rebound and follow-through so far is consistent with a
potential reversal.
If a multi-month reversal is indeed occurring, the April low is likely wave [B] of a multi-year upward flat or wave [2] of a multi-year bull trend, as indicated in Chart 6 as well as discussed in Multi-asset Outlook (5/6/11).
Squiggle counts from the low suggest that additional near term upside potential is likely (Chart 7). However, the possibility that the current rebound being wave D of a (bearish) ending diagonal cannot be ruled out.


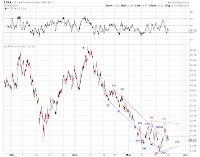
Reversal: Bonds
 Using the 10-year note as a proxy, this week's yield low in long-term U.S. Treasuries has the potential to be a trend-reversal event. The blue count in Chart 8 illustrates this bearish potential (in price) , once the bullish triangle count (red) is invalidated.